RSNA 2009: Quality Improvement?
Two months ago today, I had the opportunity to spend the morning and afternoon at the RSNA 2009 trade show event at McCormick Place in downtown Chicago. December and January have been busy and quite eventful months at my current client, and so I have not had much time to gather some of the observations I made on several exhibits.
If you have not yet had a chance to attend an RSNA (Radiological Society of North America) trade show, it is important to note that commercial and research exhibits are set up in separate areas of the convention center, which contrasts somewhat with other events held at McCormick Place, such as the annual auto show, where commerce and research tend to intermingle.
There are undoubtedly a number of reasons why RSNA research exhibits are on the lower level, but regardless of reason, I tended to concentrate on the research at RSNA, whereas at the annual auto show I tend to concentrate on the commercial. As a technology consultant, I just do not find auto research very accessible, at least in the manner it is presented. I tend to prefer viewing vehicles that have already been put into production (or are set to be on the market within the year).
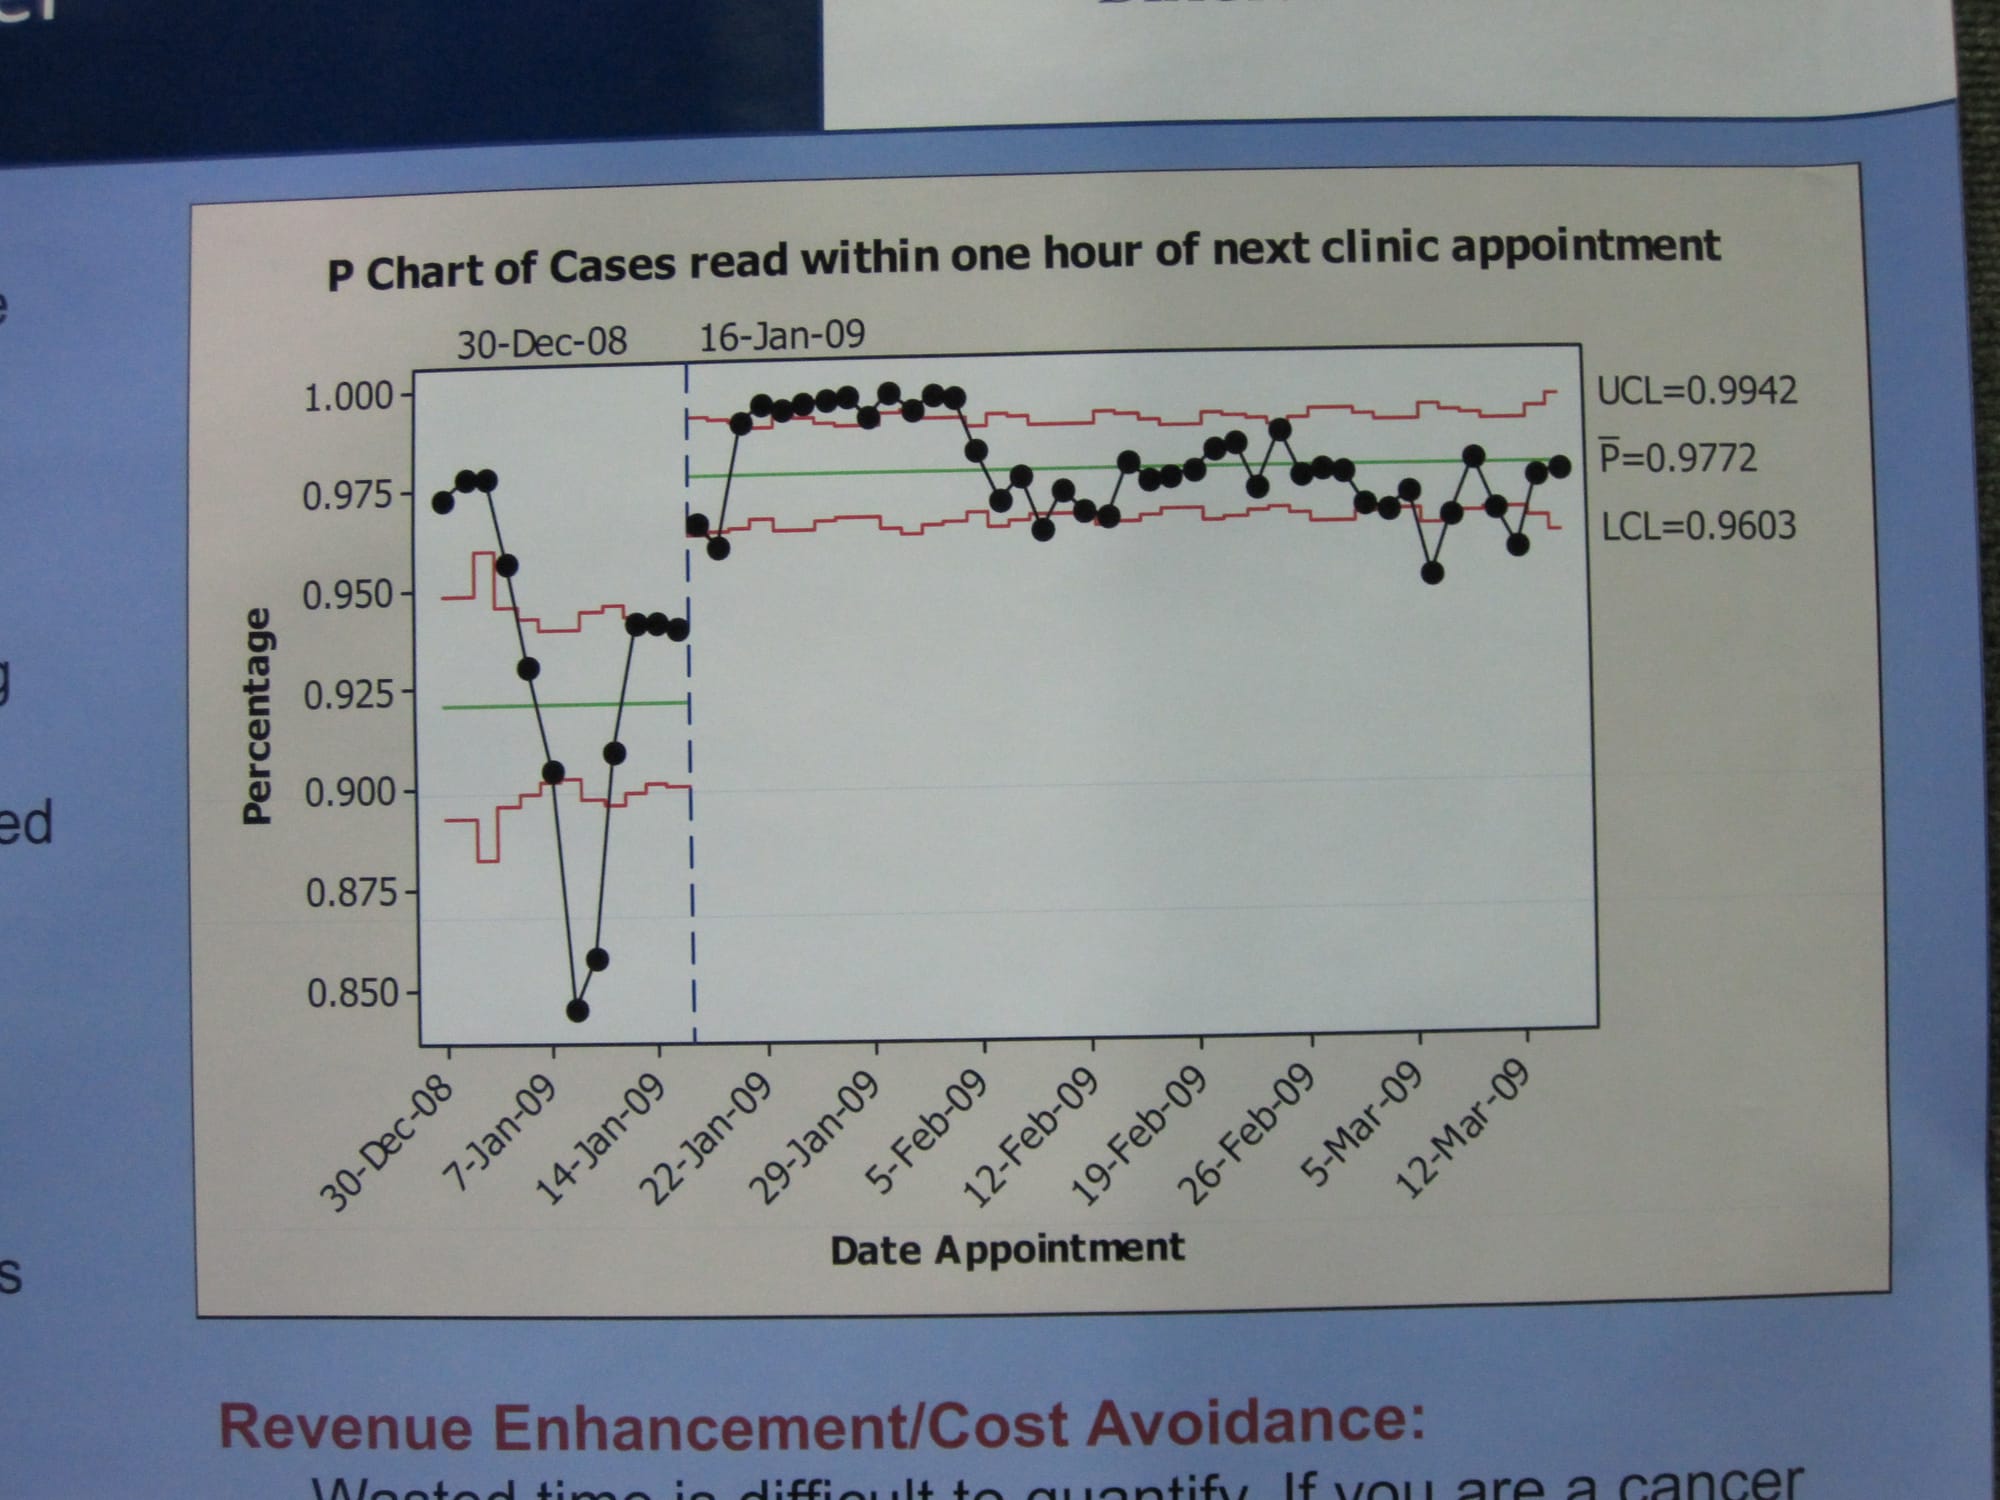
Most of my time amongst the research exhibits was spent viewing the sections devoted to health care software and quality. For the following snapshot that I took, I purposely excluded any indicator of researcher or specific project, other than the title to this p-chart which indicates that the project was intended to decrease the delay in reading patient cases to within one hour of the next clinic appointment.

The first thing that I noticed with this p-chart, a type of statistical quality control chart, is that it was created using Minitab, which was immediately followed by my observation that there is a seeming stark contrast between the data points preceding and following January 16. Of course, this was the date that the Six Sigma quality improvement measure was put into place, and the researchers aimed to demonstrate the increase in quality after that point in time.
Unfortunately, as a Six Sigma practitioner, it was also immediately evident to me that quality was not increased because Sigma is not calculable, regardless of the increase in number of cases read and seeming greater consistency of this number over time. In addition, it is not clear what the y-axis is intended to represent – is it truly percentage? It seems rather apparent that even though it is labeled "Percentage" that this certainly is not the case – a range of 0.850% to 1.000% does not seem worthy of our attention.
It is obviously very possible that the range here is intended to be 85.0% to 100.0%, but even if this were the case, the high number of failed statistical tests that would be flagged in Minitab would cast a shadow on this p-chart. In addition, it is probable that the data anomalies that occurred in early-January must have been the result of some special cause, which if removed would flatten this time series over the entire spread of dates, decreasing the magnitude of the post-January 16 time period, especially due to the short amount of time associated with the data.
Rather than percentage, I would have recommended that the researchers plot every single case according to the amount of actual time involved for each. Doing so would have increased the number of data plots considerably, giving a clearer picture of the actual raw data. Use of daily aggregates in this case was problematic and ill advised.