Pro Bono: IEEE Chicago Section Statistician - Part 5

My last post in this series on my pro bono efforts outside of the workplace as Statistician for the IEEE Chicago Section mentioned that I walked the Membership Development Chair through the visualizations of my latest monthly presentation to the team, partially in preparation for his request of me to present to the executive committee. Unfortunately, the executive committee meeting that included a number of presentations by other individuals was already behind its already tight schedule at the outset, and so my presentation time ended up being reduced to 15 minutes.
While my presentation was originally intended to cover some of the visualizations and findings of the past year, delivery probably would have benefited from a scaled down scope that concentrated on data of recent months, including the month of March 2014 which was quite coincidentally the best month across the 8 years covered by the database in terms of total active membership net difference (membership additions less membership deletions), as well as April 2014 which was the first month during this same time period where total active membership "closed the gap" in YOY total active membership.
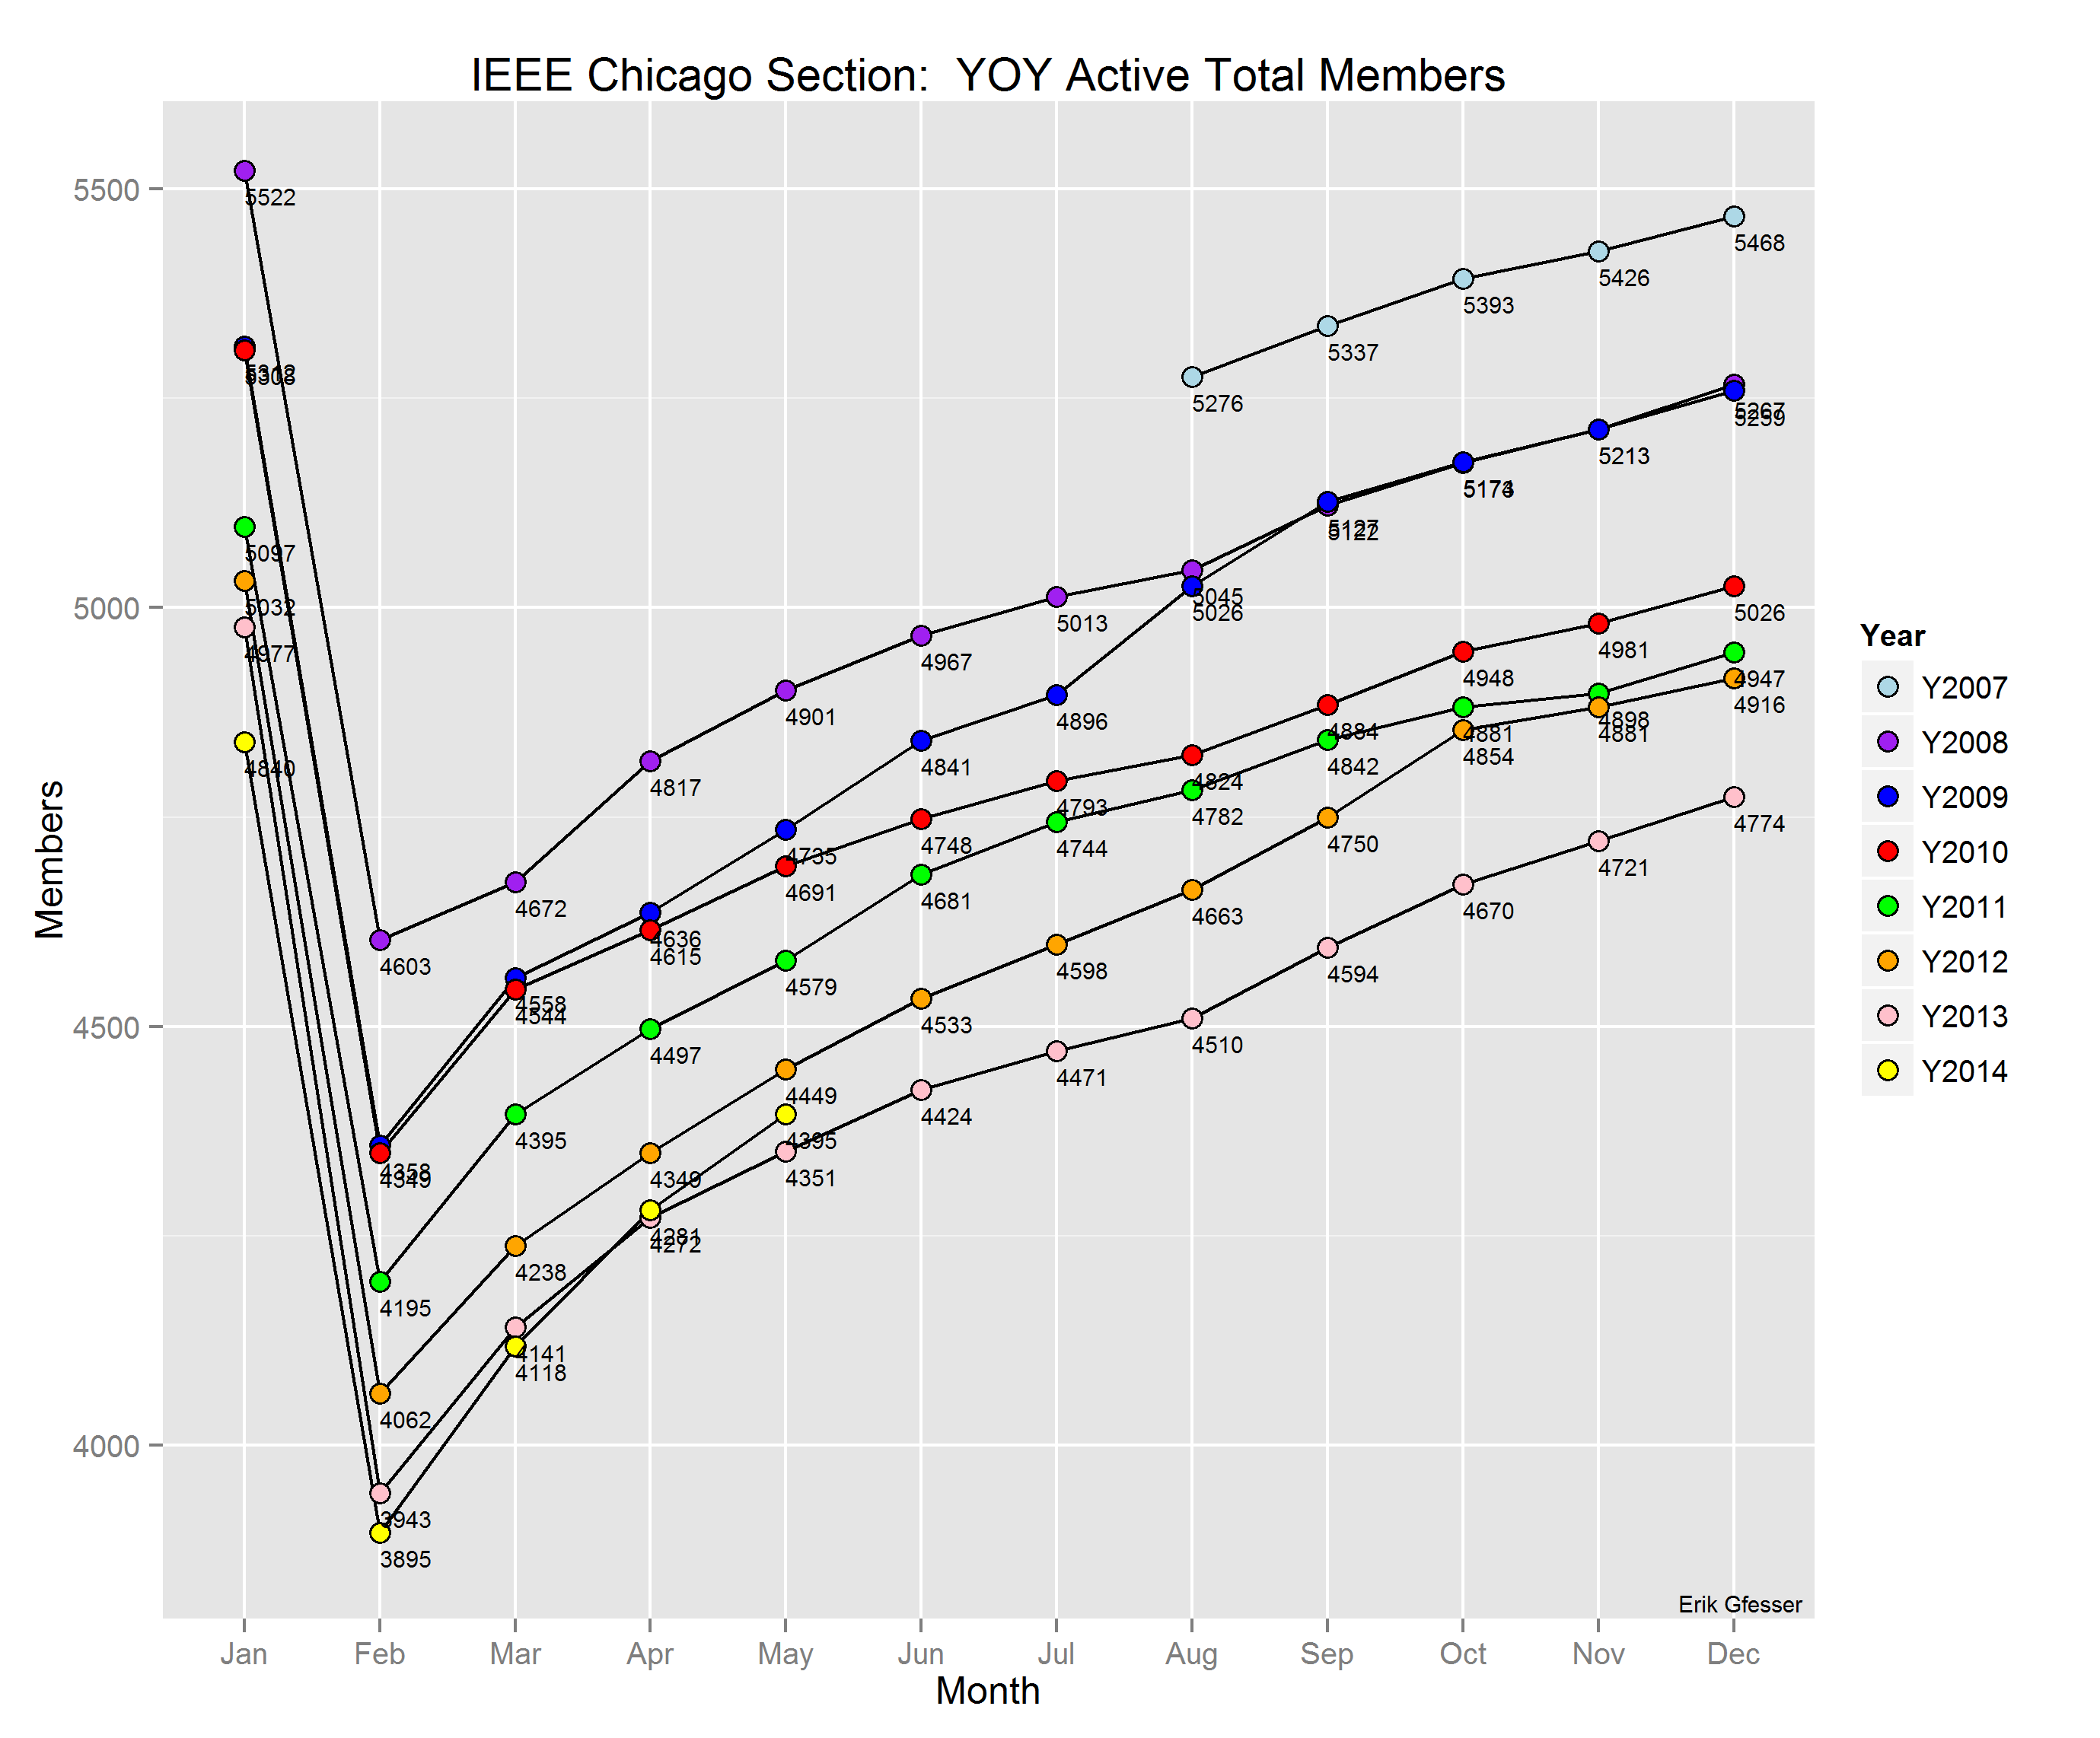
In the above plot, the line representing calendar year 2014 is on the bottom. Readers of this blog might recall that total active membership has been declining each year, but this trend has just been broken since total active membership is now above the same points of the previous year two months in a row. (Note that my plan is to overhaul these visualizations to account for color blindness. To be brief, two individuals – one of the executives discussed here, and one of my work colleagues in the workplace – recently mentioned that they are color blind. The first individual could not tell that the year 2014 was encoded with the color yellow, and the second could not distinguish between the blue and green colors I had chosen for Facts and Dimensions in the data warehouse model that I had built for the team.)
One positive result of my presentation to the executives is that the new Section Chair/President had a number of follow-up questions to ask later that same week which I was able to address. Essentially, what these questions encompassed was the ability to forecast/predict what the upcoming year is going to look like in terms of membership numbers. Questions such as this came as no surprise to someone in the trenches with the data. However, in response I emphasized that what I have been putting together for the team is descriptive analytics, not predictive analytics. No visualizations that have been provided to date should be seen as predictive analytics.
As explained to the new Section Chair/President, I could easily create what some might view as predictive graphs, such as trend lines etc, but I would be doing the Section a disservice by doing so, since these would not be accurate. In thinking about what helps predict future months, it really has a lot to do with individual members. It also has a lot to do with the economy and general industry trends, but these are fairly abstract concepts – even the government cannot predict unemployment rates and is always adjusting past months. In thinking about individual members – their demographics, education, fields of work, technical interests, etc – these are the core factors upon which models can be built to predict the types of individuals we are attracting and the types of individuals who choose to leave. Unfortunately, we do not have access to member credit ratings, but if we did, these might additionally help predict who will fail to keep up with their membership dues and go into arrears each year.
Assembling data sets created from the database in order to start capturing this information might be a start, but it would be a slow process because I would only be able to assemble data sets of the current month for which data is available. Once the data is updated for the next month, much of the information of the prior month is no longer made available in the database. The aggregate totals are still there, but not the data from which these aggregates were created. As discussed with the team, at minimum I would need the ability to query the database to determine whether an individual was active for a particular month in the past, but the historical member grades that the database tracks for each individual alongside the historical statuses of members (when corporate IEEE decides to provide this information) would only be a start. As discussed with corporate IEEE last year, essentially all of the data needs to be effective dated.
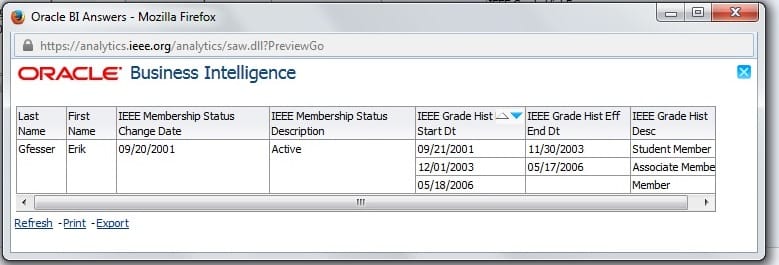
To provide readers a better understanding of the current state of the IEEE membership database, below are some screenshots of the Oracle Business Intelligence Enterprise Edition (OBIEE) 11g user interface. The first screenshot shows a small subset of the data available about me that is specific to historical member grade effective dates. Starting as a Student Member during graduate school, I was later elevated to Associate Member, Member, and most recently, Senior Member. The memberbership status field apparently indicates that I was in Active status during all of these time periods, with no other statuses.
Now take a look at the next screen shot, which contains similar items, albeit for another member that I anonymized by not including any personally identifiable data. In quering data for this individual, I also ordered by historical member grade effective date. As you can see, this member has a long history with IEEE, and was elevated to Life Senior membership status over 25 years ago. While the membership status change date for my entry above is the same as the start date for my first historical member grade, however, notice that membership status change date for this other individual is just a few months ago. So why does the membership status field indicate Inactive for all time periods? Because the database does not track historical member status and only records current status.
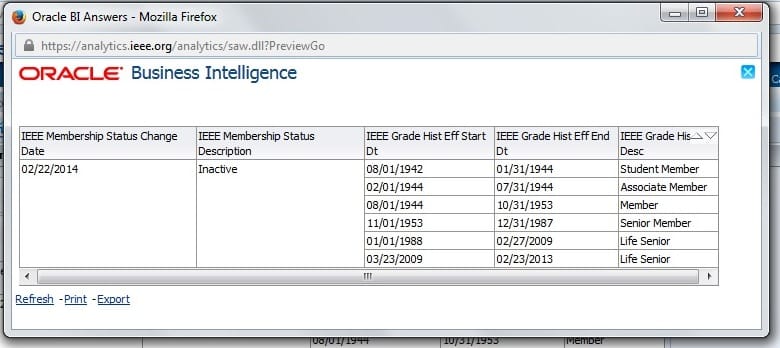
This particular data is very unuseful, unless perhaps the user only cares about current state, or is willing to keep track of changes over time in a separately maintained data set outside of the IEEE membership database. But notice another apparent anomaly. The membership status change date is one day removed from the most recent historical member grade termination date. While this data might be accurate, it seems very odd that the two dates do not line up with one another. Essentially, what this example seems to imply is that a presumably active Life Senior member went into Inactive status with one day to spare. And this anomaly does not even address the fact that this time period is the second of two as Life Senior member. Why are there two time periods? The database simply does not divulge this information.
In thinking about the models that can be built with predictive analytics in mind, consider the data associated with personal updates that LinkedIn provides to its members. For readers not famliar with this feature of LinkedIn, personal updates are essentially a text box via which members can share messages with their connections. For this discussion, the content of these messages is not technically important, but keep in mind that these personal updates are often used to communicate career related events and share blog posts such as the one you are reading right now. For illustration, I captured some screenshots of another LinkedIn feature labeled "Who's Viewed Your Updates" that is directly linked to the personal updates feature.
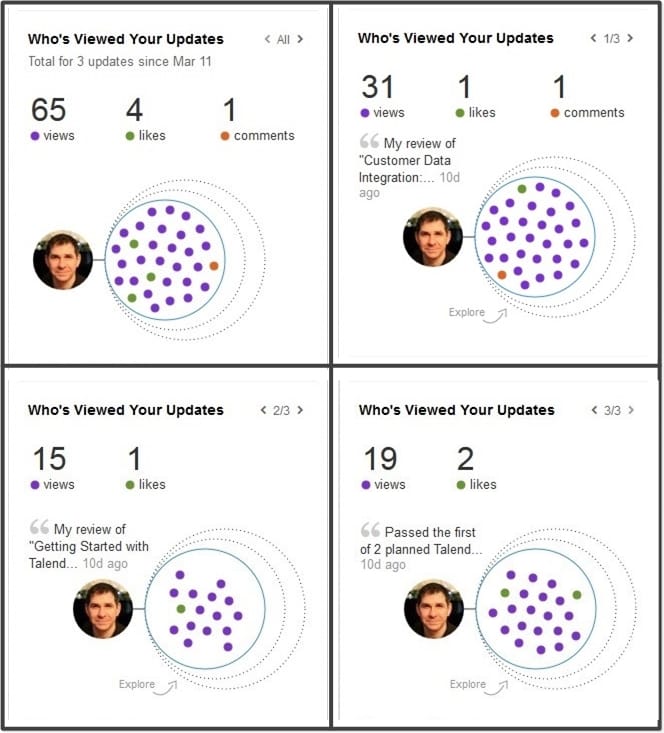
The above four screenshots, clockwise starting with the upper left screenshot, are intended to show who viewed three personal updates that had been shared in early March 2014. The first screen shot is a summary of the latter three screenshots, which are broken down by each individual update. Fortunately, the numbers add up. There were 65 total views by my connections of these updates (31 + 15 + 19 = 65), 4 total likes (1 + 1 + 2 = 4), and 1 comment. While this is basic math, notice that the plots that LinkedIn provides do not match these numbers. At some point, LinkedIn must have determined that there is a saturation point with the number of data points being depicted. Although this is a general observation, because this only seems to apply to the total number of views, note the number of likes and comments, which are accurate.
So what does all of this have to do with predictive analytics? The key word in this LinkedIn feature is "who" – "who" has viewed particular personal updates. Where is the "who"? If I hover my cursor above one of these data points, does a depiction of the associated LinkedIn connection materialize nearby? No. All that can be reviewed by a member here are counts. A member cannot actually take a look at who viewed their updates. With the assumption that I have the same number of LinkedIn connections in the future when another personal update is posted, is there any way for me to determine how many will view, like, or comment? Probably not. As colleagues have heard me say on a number of occasions over the years, anything is possible – but not everything is probable. Now consider a recent personal update that is separated in time from the previous three updates by a few months.
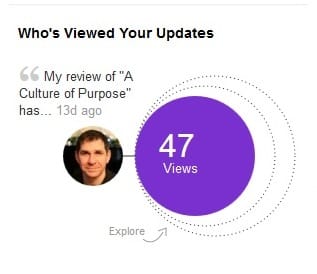
What, no data points? We already established that there is no "who" per se in the equation. And we know from the first example from a few months ago that the total number of 47 data points would not be included if these were depicted. But why are there no data points? Well, it turns out that LinkedIn has decided that unless there are likes or comments, all of the data points would simply be views and so these would not provide any value. Perhaps. But one can argue that only displaying a subset of total data points alongside total likes and comments can be misleading, giving the impression that the ratio of likes and comments to total views is actually higher than it actually is in reality.
What all of these observations have in common is that in order to predict, one needs to be able to drill down to the individual data points to understand the characteristics of each so that the likelihood of appearance of other data points in the future exhibiting similar characteristics can be ascertained. In looking at what is currently made available to LinkedIn members, one cannot determine the audience of personal updates. And while granular information about IEEE members is technically being made available for the current month during which the database is being queried, this information is not being made available on a historical basis. Going back to my plot of total member count from May 2014 above, we do know that increasing senior member count has had a big impact in recent months, and the database does keep track of the types of member additions and deletions that take place over time, but we need to understand the characteristics of members behind these numbers. Looking at total counts does not really show the big picture.
Pro Bono: IEEE Chicago Section Statistician – Part 1, Part 2, Part 3, Part 4