Big Data in Finance Day Chicago (September 18, 2012)

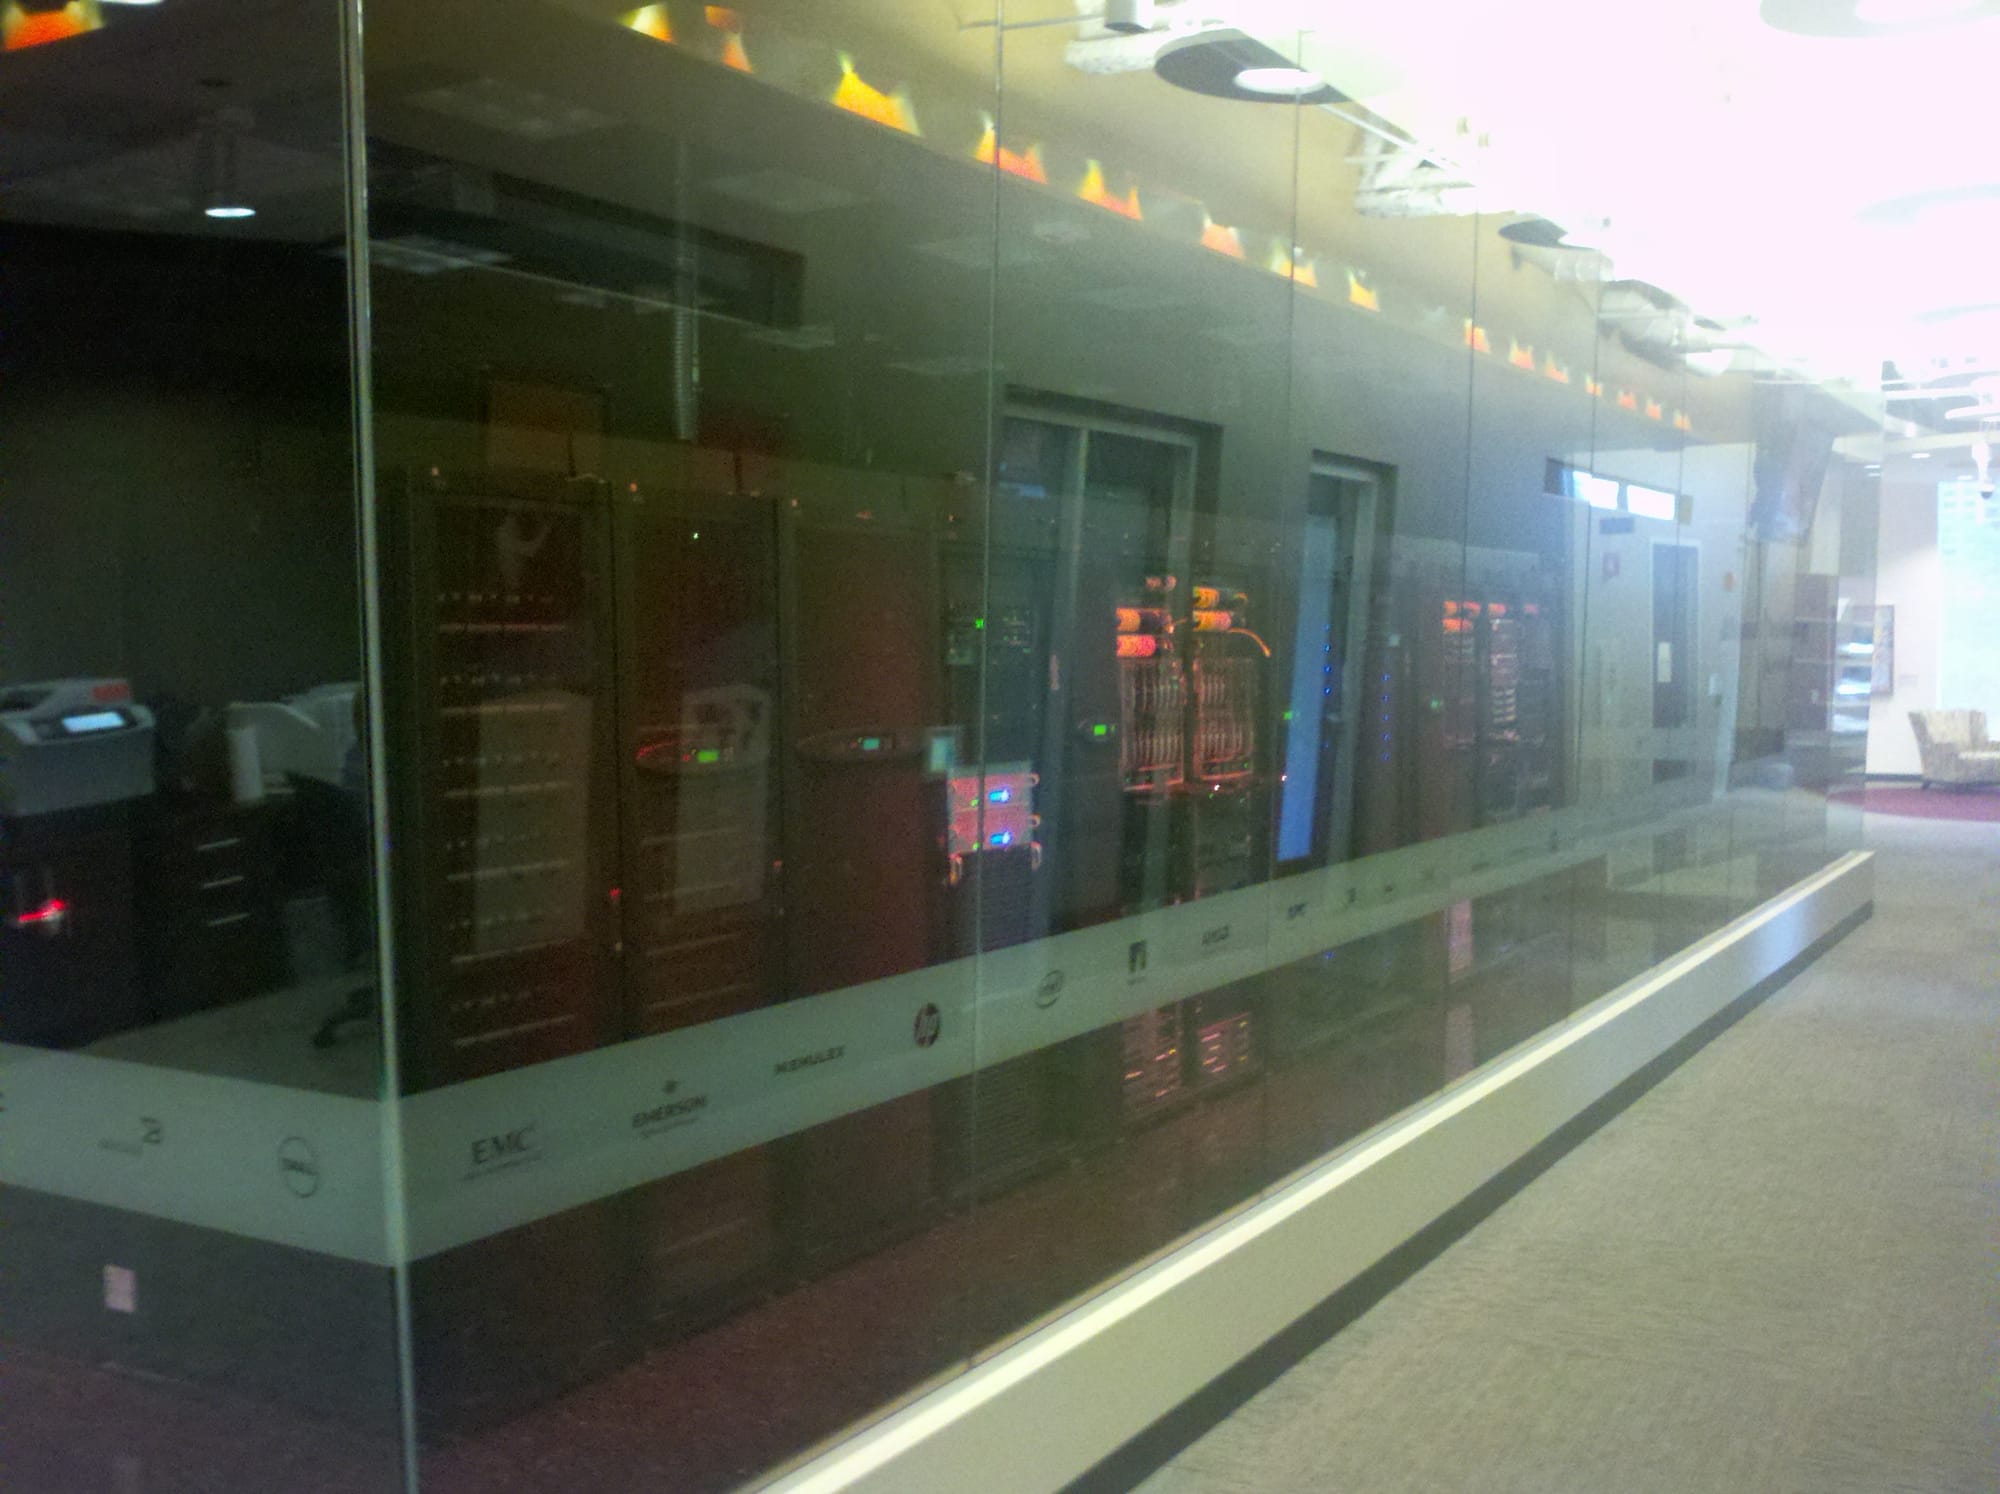
Personal notes from Big Data in Finance Day Chicago that I recently attended at Microsoft Technology Center Chicago. In speaking with event organizer and Fountainhead owner Andrew "Shep" Sheppard (a self-described quant by day and meetup organizer by night), following the last session, he mentioned that the first Big Data in Finance Day was held in New York City on March 26, 2012, and elaborated on his plans by indicating that the next conferences in this series will be held in Boston and London.
After finding out about this conference through Chicago Big Data, I offered to do a write-up about the conference on my blog, similar in spirit to the one I had posted following my attendance at BigDataCamp Chicago, in exchange for fees being waived, so I attended all 14 sessions of this marathon day-long event. By the time mid-afternoon came around, a number of attendees had already left, but I am glad that I held out, as one of the best sessions of the day, led by Dr. Phil Shelley, CTO of Sears Holdings and CEO of MetaScale, occurred late in the day.
The alternate name for this event was Hadoop in Finance Day Chicago. It will not take long for anyone in the Big Data space to realize that a summoning of the open source Apache Hadoop product is often performed alongside mentions of Big Data because of its ubiquitous influence in projects of this genre, as well as its ubiquitous presence in commercial products in this space. While most of the sessions included Hadoop discussions, working with Big Data goes beyond what any one product can solve, and so the number of topics was broad.
8:45am – Registration
8:45am – Welcome address
9:00am – "Big Data in Finance by the Numbers: Data about Big Data"
9:30am – "Big Data at CME Group: Challenges and Opportunities"
10:00am – Break
10:30am – "Big Data in Finance: A Regulator's Perspective"
11:00am – "Hadoop: A (Very) Brief Introduction"
11:30am – "Hadoop in Financial Services"
12:00pm – Lunch
12:00pm – Lunch and learns: "MATLAB and Hadoop" and "An Integrator's Perspective: Big Data in Finance"
1:15pm – "Big Data Meets Cloud: The Perfect Arranged Marriage"
1:45pm – Panel discussion
2:30pm – "OK, So You've Decided to Put Data in Hadoop. Now what?"
3:00pm – Break
3:30pm – "Scalability in Hadoop and Similar Systems"
4:00pm – "Scaling Out Excel Using Windows Azure and Hadoop"
4:30pm – "Data Analysis with Hadoop"
5:00pm – "How VoltDB is Making Hadoop a More Productive Tool for the Enterprise"
5:30pm – "Raw Data to Real-time Decisions: Feedback Loops Using CEP and Hadoop"
6:00pm – Wrap-up
6:15pm – Drinks reception
"Big Data in Finance by the Numbers: Data about Big Data"
"Data in finance is growing quickly, driven by a number of factors from increased trading volume to new and far reaching regulatory mandates. This talk will discuss (and quantify) where we are with big data in finance, and more importantly, where we seem to be heading."
Agenda:
– golden age of computational discovery
– what is Big Data anyway?
– let's look at the numbers
– what's driving this?
– where do we go from here?
– a cautionary warning (Big Data: a health warning!)
– Andrew Sheppard, Fountainhead
Shep started his talk by presenting a draft sketch that he had created for O'Reilly a while back of computational power available to the individual throughout history. The graph showed an expansion of CPU and CPU mulitcore, GPU, CPU Cloud, and Cloud + GPU during the last 10 years (2000-2010). The speaker declared that it is a golden age of computational discovery across the board, including in finance.
What is Big Data? "Any data set that is too big or too cumbersome to work with in Excel, or takes too long to calculate." With Microsoft Excel 64-bit, this means data in the 10's of GB range. What is Big Data? "Any data set that has you asking yourself the question, 'Does this belong in Hadoop?" There are 3 dimensions of data: volume (or quantity), complexity (or variety), and speed (or velocity).
According to IBM, 90% of all the data in the world was created in the last 2 years. How many years until Big Data spending dominates IT spending? According to one estimate, 8 years. The size of the market for financial data is $23.2B, probably the most organized data market. Counterparty Valuation Adjustment (CVA) is a Big Data and big compute problem. Typical bank-wide CVA may involve millions of trades; some complex derivatives that are expensive to price. The half-life of financial data can be quite short.
Shep quoted someone who said that most of the time they spend drinking, and the rest is a waste of their time. He used this as an analogy to say that soon we should be doing Big Data most of the time, because otherwise the rest will be a waste.
There are 4 factors driving Big Data growth: technical capability (computing cost), greed (opportunity), feat (competitive advantage), and regulation. The number one factor is making money, and the second is fear. One thing that is often overlooked is the fact that analysis itself is a source of Big Data. In some cases, derived data can dwarf the original data set.
Examples in finance include High-frequency Trading (HFT), news bots, scenario analysis and stress tests, and data sets that often feed on themselves. Certain trends have been established and will continue: trading volumes will continue their rapid growth, and machine trading (trade that involves machines trading autonomously) will become the norm.
Data standards and formats will improve. And there are social implications with Big Data. Big Data in many ways is being redefined as Hadoop in the sense that these two are more often than not in the same sentence. Hadoop is just one NoSQL data store. We are going to see more domain specific languages (DSLs) for Big Data.
Enormous economic value is and will be extracted from Big Data, otherwise Big Data would not be growing. There are regulatory factors. Better data life cycle models, from creation to deletion are needed, along with data cleansing and scrubbing. In short, there are huge challenges, but also huge opportunities. The Big Data market is expected to grow to $16.9B in 2015.
Apophenia: "The experience of seeing meaningful patterns or connections in random or meaningless data. The term was coined in 1958 by Klaus Conrad, who defined it as the 'unmotivated seeing of connections' accompanied by a 'specific experience of an abnormal meaningfulness'."
Remember this: "Without data, it is just an opinion!" Shep noted that the Hadoop vendors are "attending today in full force" because work is not being done in a vacuum to develop solutions. Creating actionable knowledge is still in the baby phase.
One attendee asked what has really changed, since finance has been working with significant amounts of data for quite some time. Shep responded by saying that what has changed is the sheer velocity and speed of data. Hadoop has become important because the amount of data has increased so rapidly. Shep argued that data is more or less random, and there are tests to determine the extend of randomness, but this is a topic that could consume an entire day in itself.
"Big Data at CME Group: Challenges and Opportunities"
"Find out how one company is meeting the challenges and opportunities of Big Data."
Agenda:
– CME group overview
– Big Data at cme group
– Big Data use cases at CME Group
– Big Data challenges and opportunities at CME Group
– Big Data key learnings at CME Group
– Rick Fath and Slim Baltagi, CME Group
Rick did most of the talking during this session, and Slim joined Rick and others for the discussion panel later in the event. He started by reviewing at a high level where CME Group is at today, including the fact that it is the number one exchange in the United States, and globally by 2011 trading volume with 11.8 million contracts per day. The company has a strong record of growth, both organically and through acquisitions.
The speaker mentioned that he was "one of the fortunate ones" to attend the Hadoop Summit this year. While Shep offered two different answers to the question "What is Big Data?", Rick offered a third: "Big Data = transactions + interactions + observations". A massive amount of transactional data important for business.
His group had to learn Hadoop on their own, because not a lot of books or training was available. This comment is similar to a comment that Shep made earlier, that a lot of the time problems he works on involve stuff being thrown at him that he is asked to just figure out. As a consultant, I can relate.
Data is not merely a byproduct at CME Group, but is an essential deliverable. Daily market data generated by the exchange, as well as historical data. Growing partnerships around the world. The message here was that the volume of data is always growing, so leveraging legacy tools versus adopting new Big Data technologies needed to be investigated. Not all data was being stored, and quality was lacking, and they needed to learn from this lesson. Rick offered three use cases.
Use Case #1: CME Group's BI solution. Provides complex reporting and data analysis for internal business teams. Challenges: high performance is needed (existing queries were taking 18+ hours to execute), as well as working with established tools and partnerships. (The speaker went through this use case quickly, so I did not have enough time to get down more notes.)
Opportunities: Structured RDBMS, minimize integration impact, enhance customer analytics, deliver faster time to market, improve and increase fact-based decision making, and reduce execution duration of batch processes. Why they chose a data warehouse appliance: no need to reengineer Oracle database. (The speaker went through this use case quickly, so I did not have enough time to get down more notes.)
Use Case #2: CME Group's rapid data platform. Reduce reliance on SAN while increasing query performance. Challenges: expensive storage, Oracle queries cannot keep up with inserts and do not meet SLAs. Opportunities: reduce storage cost. (The speaker went through this use case quickly, so I did not have enough time to get down more notes.)
Use Case #3: CME Group's historical data platform. Provide historical market data to exchange customer challenges. Challenges: expensive storage cost, legacy downstream application with limited support, historical data from acquisitions and mergers ("don't look for problems, because you will find them"), 100TB and growing, data redundancy and quality (limited awareness).
Opportunities: Reduce storage cost with non-specialized hardware ("not commodity"), reduce duplication of data, improve data quality with better interrogation, grow the business (new datasets, mashups, analytics), separate delivery from storage ("store everything and deliver what you need"), enable business users (ad hoc queries, define new datasets), reduce TCO (support, improve reliability).
Why was Hadoop chosen? Solution built for scale and growth, structure of data does not matter ("data is the data"), Hadoop as ETL solution, performance POC with Oracle (the reason the project got funded was because it beat Oracle queries, and removes duplication), decouple storage and delivery ("store raw data, deliver enhanced data"), ecosystem reduces development time and provides solutions to common problems, structure is fluid, perfect for historical data.
But there are enterprise challenges. Open source paradigm (infrastructure counterparts start to be brought into the room), enterprise maturity built for failure ("don't mention 'built for failure' to the infrastructure guys"), operations readiness, framework can mask problems, educate the enterprise about Hadoop, evolution of Hadoop.
Deployment challenges include selection of Hadoop distribution, growing cluster equals growing support fees (how to lower maintenance fees), future project candidates (super cluster versus individual cluster), distributions support and alignment, maximize investment in its assets. (The speaker went through this material quickly, so I did not have enough time to get down more notes.)
CME Group learned to embrace open source, enterprise readiness, solve operational maturity, leverage existing IT investments, adapt standards to make cluster more supportable, tackling the learning curve (keep close to the community), leverage the Hadoop ecosystem, capture everything for integrity purposes etc by keeping it raw (data does not need to be structured), capture data first and then figure out opportunities (opportunities might not be there now, but may be in the future, Hadoop can be complimentary to existing IT assets).
Apache HBase was chosen for the first use case because it involved a historical data system not requiring speed. The other use cases required high performance, so used HDFS. In industry, 80% of Hadoop users use HDFS, 20% use HBase and Apache Hive. There is no one size fits all, and Hadoop may not even be the right solution for some applications. "Big Data is not Hadoop."
Most of the data at CME Group is structured, but the affect of the news on trading patterns etc requires analysis of unstructured data. CME Group production cluster is 15 data nodes, about 50TB, with up to 384GB of RAM per machine, so not using commodity hardware in this case. For marketing purposes, Hadoop is supposed to be best on commodity hardware, but this is not always the case. HBase is much more stable now, much less risk than a year ago, so things are moving fast in terms of maturity.
"Big Data in Finance: A Regulator's Perspective"
"Big Data more and more falls under the purview of the regulators. You'd better understand the issues before embarking on that Big Data project."
Agenda:
– preamble: "a regulators lot"
– what is regulation anyway?
– how is regulation driving big data?
– an example: bank-wide cva
– who regulates what? an american perspective
– a look at dodd-frank
– a parting question
– Andrew Sheppard, Fountainhead
Shep noted that he tried to get a regulator to speak at this event to no avail. He was able to get one to speak for the event held earlier in New York City, but that individual has since decided to move on as a professor at MIT.
The speaker started the discussion by exclaiming that "this is the hardest talk of the day". Regulators have to be reactive rather than proactive: "first do no harm". If you thought your "corporate relations" department was difficult to deal with, try the government! Winston Churchill was quoted as saying that "democracy is the worst form of government…except all the others that have been tried".
From the perspective of a regulator, Big Data in finance is both a boon and a liability. Boon because it offers the possibility of better and more timely reporting of the numbers with an audit trail. Liability because events of importance may be lost, or indeed hidden, in vast amounts of data. When things go wrong, it is often only the data that tells a complete and impartial story of the events.
Working definition of "regulation": "the purpose of financial regulation is to supervise and oversee financial markets so that they function properly and efficiently, and specifically, to maintain integrity of the system so that major dysfunction and crises are avoided."
Shep mentioned that there are three regulators in the audience today. Regulations, by their very nature, are mandates: regulators want more timely reporting of data, regulators want better, more accurate, numbers, regulators want an audit trail, regulators want accountability.
Example: bank-wide CVA. CVA is both a Big Data problem and a big compute problem: 10m trades, 10k Monte Carlo paths, 100 time steps – that's 10^3 valuations to get just one CVA number! Will likely be mandated by the regulators in the next couple years. Basel III and the cost of capital.
Many countries have a single regulator. The United States has many: SEC, FINRA, CFTC, the "Fed", FDIC, OCC, NCUA, OTS. Shep offered the reminder that one needs to adhere to mandates if one is doing a Big Data project in finance.
The Dodd-Frank Act is 1k pages of new regulations: Title VII of the Dodd-Frank Act is a technological overhaul of the derivatives markets. Dodd-Frank effectively overhauls trading technology from the 19th to 21st century, risk mitigation technology from decentralization to Central Counterparty Clearning (CCP), data and documents (human-readable to machine-readable), and transparency to regulators, to counterparties, to the market.
New data required for Dodd-Frank includes clear data, messages, trade capture, market feed, reports to markets, regulators, and the public. If data is not real-time here, its worth is minimal
Pre-Dodd-Frank, it is not like no data was being captured, but different data is being captured, and on a more timely basis. All of the old stuff, plus the new stuff. Post-Dodd-Frank requirements include more machine readable, more standardized, and more easily available, more trade data, more forms/reports, more formats/representations/dictionaries, more connections to data sources/access issues, more quality control issues, more data security issues, more legal issues.
How can a Big Data approach help? It helps with data capacity/storage/retrieval, data access/security, data processing, data analysis. It is not all bad news.
Shep asked attendees, by show of hands, if we had more data and more compute power going into the recent financial crisis, whether the outcome would have been less severe, the same, or much worse. Of an audience of hundreds, 2 attendees voted that it would have been less severe, about one-third of the room said it would have been about the same, and about 10% to 15% of the attendees said it would have been much worse.
The speaker noted that when he had asked this question at the New York City session, not one hand was raised for "less severe". The question that he then posed was that if nobody seems to believe that the outcome would have been "less severe", why are we investing in all of this technology?
Do the regulators have the skills to understand the data being handed to them? Shep mentioned that someone from FINRA mentioned before his talk today that we are the best ones to understand the data – the folks that actually created it etc.
Shep mentioned that he really does not know how much it will cost to address Dodd-Frank, but he expects it to be very expensive. As someone working in the trenches, he thinks that we will be feeling our way. Even with an estimate, there will be a huge spread depending on company focus.
"Hadoop: A (Very) Brief Introduction"
"Hadoop is more than a single tool, it is the hub in a wheel of complementary tools (Hive, Pig, HBase, Mahout, and others). This talk gives an overview of the Hadoop tools set."
Agenda:
– high-level overview of hadoop
– deeper dive into hadoop components
– the hadoop ecosystem
– Jonathan Seidmann, Solutions Architect/Partner Engineering at Cloudera
Note that I took very few notes during this session, because I was already familiar with the bulk of the information presented.
Apache Hadoop 2.0 now supports high availability. Data nodes use local storage in a JBOD (Just a Bunch of Disks) configuration, not RAID, which allows Hadoop to round-robin I/O requests. New Hadoop releases address NameNode crashes, a problem with earlier releases.
The Hadoop ecosystem according to Jonathan includes more tools than often presented, and includes Apache Hive, Apache HBase, Apache Pig, Apache Mahout, Rhadoop, RHIPE, Cloudera Hue, Karmasphere Studio, Cloudera Manager, Apache (Incubator) Ambari, Apache Sqoop.
Currently, Hadoop provides manual failover to the standby NameNode, but soon an automatic failover will be made available.
"Hadoop in Financial Services"
"Hadoop is already finding wide application in financial services, a trend that looks set to expand considerably in the coming years. This talk covers how Hadoop is currently being used with financial Big Data, and where it might find even wider application in the future. Basically, how financial Big Data fits together with Hadoop."
– Adam Gugliciello, Solutions Engineer at Datameer
Datameer is a business intelligence (BI) tool that runs in Hadoop. Most use cases that Adam sees are not possible with the old paradigm: ETL, data warehouse, BI. If any of these pieces change, you need to go back to the drawing board to reevaluate. What the speaker has typically seen is that 6 to 12 weeks is typically required to act on a change in these areas.
Hadoop and Datameer enable fast raw loads, the ability for data scientists, analysts, etc to define the problem to be solved, etc, and self service including drag and drop, spreadsheets. These common themes ran throughout all of the use cases he presented during this session.
Use Case #1: Internal asset movement. Focus: Institutional risk. Identify departmental asset movement. Actual "rogue trader" identified using Datameer. Craft an early warning system for future detection. Aggregate sources and correlate. Net result: Reduced risk.
Use Case #2: Client risk profiling. Focus: Bank assets. Identify profile-scoring features in loans and mortgages. Build qualifying models with Datameer. Test models against existing data. Provide recurring reports. Focus: Client assets. Monitor risk across product offerings for all client assets. Develop common base of client characteristics for models. Analyze risk types: default, liquidity, attrition risk. Monitor: Transactions, web, email, chats, and call logs (all of the different ways that clients interact with the bank). Net result: Correlation and increases agility.
Use Case #3: SLA analytics. Focus: Infrastructure performance. Companies are using Datameer to aggregate all logs to Hadoop. Transform log data into actionable insight into IT systems performance. Measure conformance to existing SLAs. Reduce the batch window. Net result: Reduced costs.
Use Case #4: Security fraud. Focus: Client protection. Run statistical models against customer profiles. Detect anomalies with pattern recognition algorithms. Identify and investigate identity theft. Detect and prevent fraud. Protect customer assets. Net result: Protected customers.
Use Case #5: Data quality and profiling. Focus: Profiling. Use profiling techniques to assess and score client accounts. Run complex data quality rules and models. Build exception reporting. Focus: Data quality. Enable data stewards to run ad hoc analysis and dashboards. Drive iterative processes to refine data. Net result: Reduce risk and cost.
Use Case #6: Security infrastructure. Focus: Infrastructure protection. Monitor external intrusions. Detect suspicious traffic. Net result: Increased security.
Use Case #7: Dark pools and cost savings. Focus: Trade and partner analysis. Financial institutions often hold large positions that they want to trade in ways that do not affect public markets. Dark pools are private venues that enable trading. (The speaker went through this material quickly, so I did not have enough time to get down more notes.) One caveat here is that the speaker mentioned that he has not spent a lot of time in this area.
Adam commented that Datameer and Hadoop bring commoditization, and data out of the back room. Mainframes and RDBMS are not going away. While RDBMS disrupted mainframes, Hadoop disrupted RDBMS. Datameer is used to prepare data for Cognos etc, and is also used for the data analysis layer etc. Datameer uses array analysis rather than set theory analysis.
"MATLAB and Hadoop"
"A first look at methods of bringing MATLAB numerical analysis to large data through Hadoop. During lunch, Eugene McGoldrick, Director of Development for Financial and Application Development from MathWorks, Inc. will discuss options for integration of MATLAB execution on Hadoop infrastructure."
– Eugene McGoldrick
MathWorks is turning MATLAB into a financial development environment. MATLAB provides numerical analysis, data analysis and visualization, algorithm development, and application development.
Mathworks provides financial products that run on top of MATLAB to do financial analysis etc. MATLAB compiler and builder products automatically packages your MATLAB programs as standalone applications, software components, and targeted programming/application environments. The full MATLAB language is supported allong with most toolboxes. Allows for royalty-free deployment. You can run Java etc components outside of MATLAB environment once compiled.
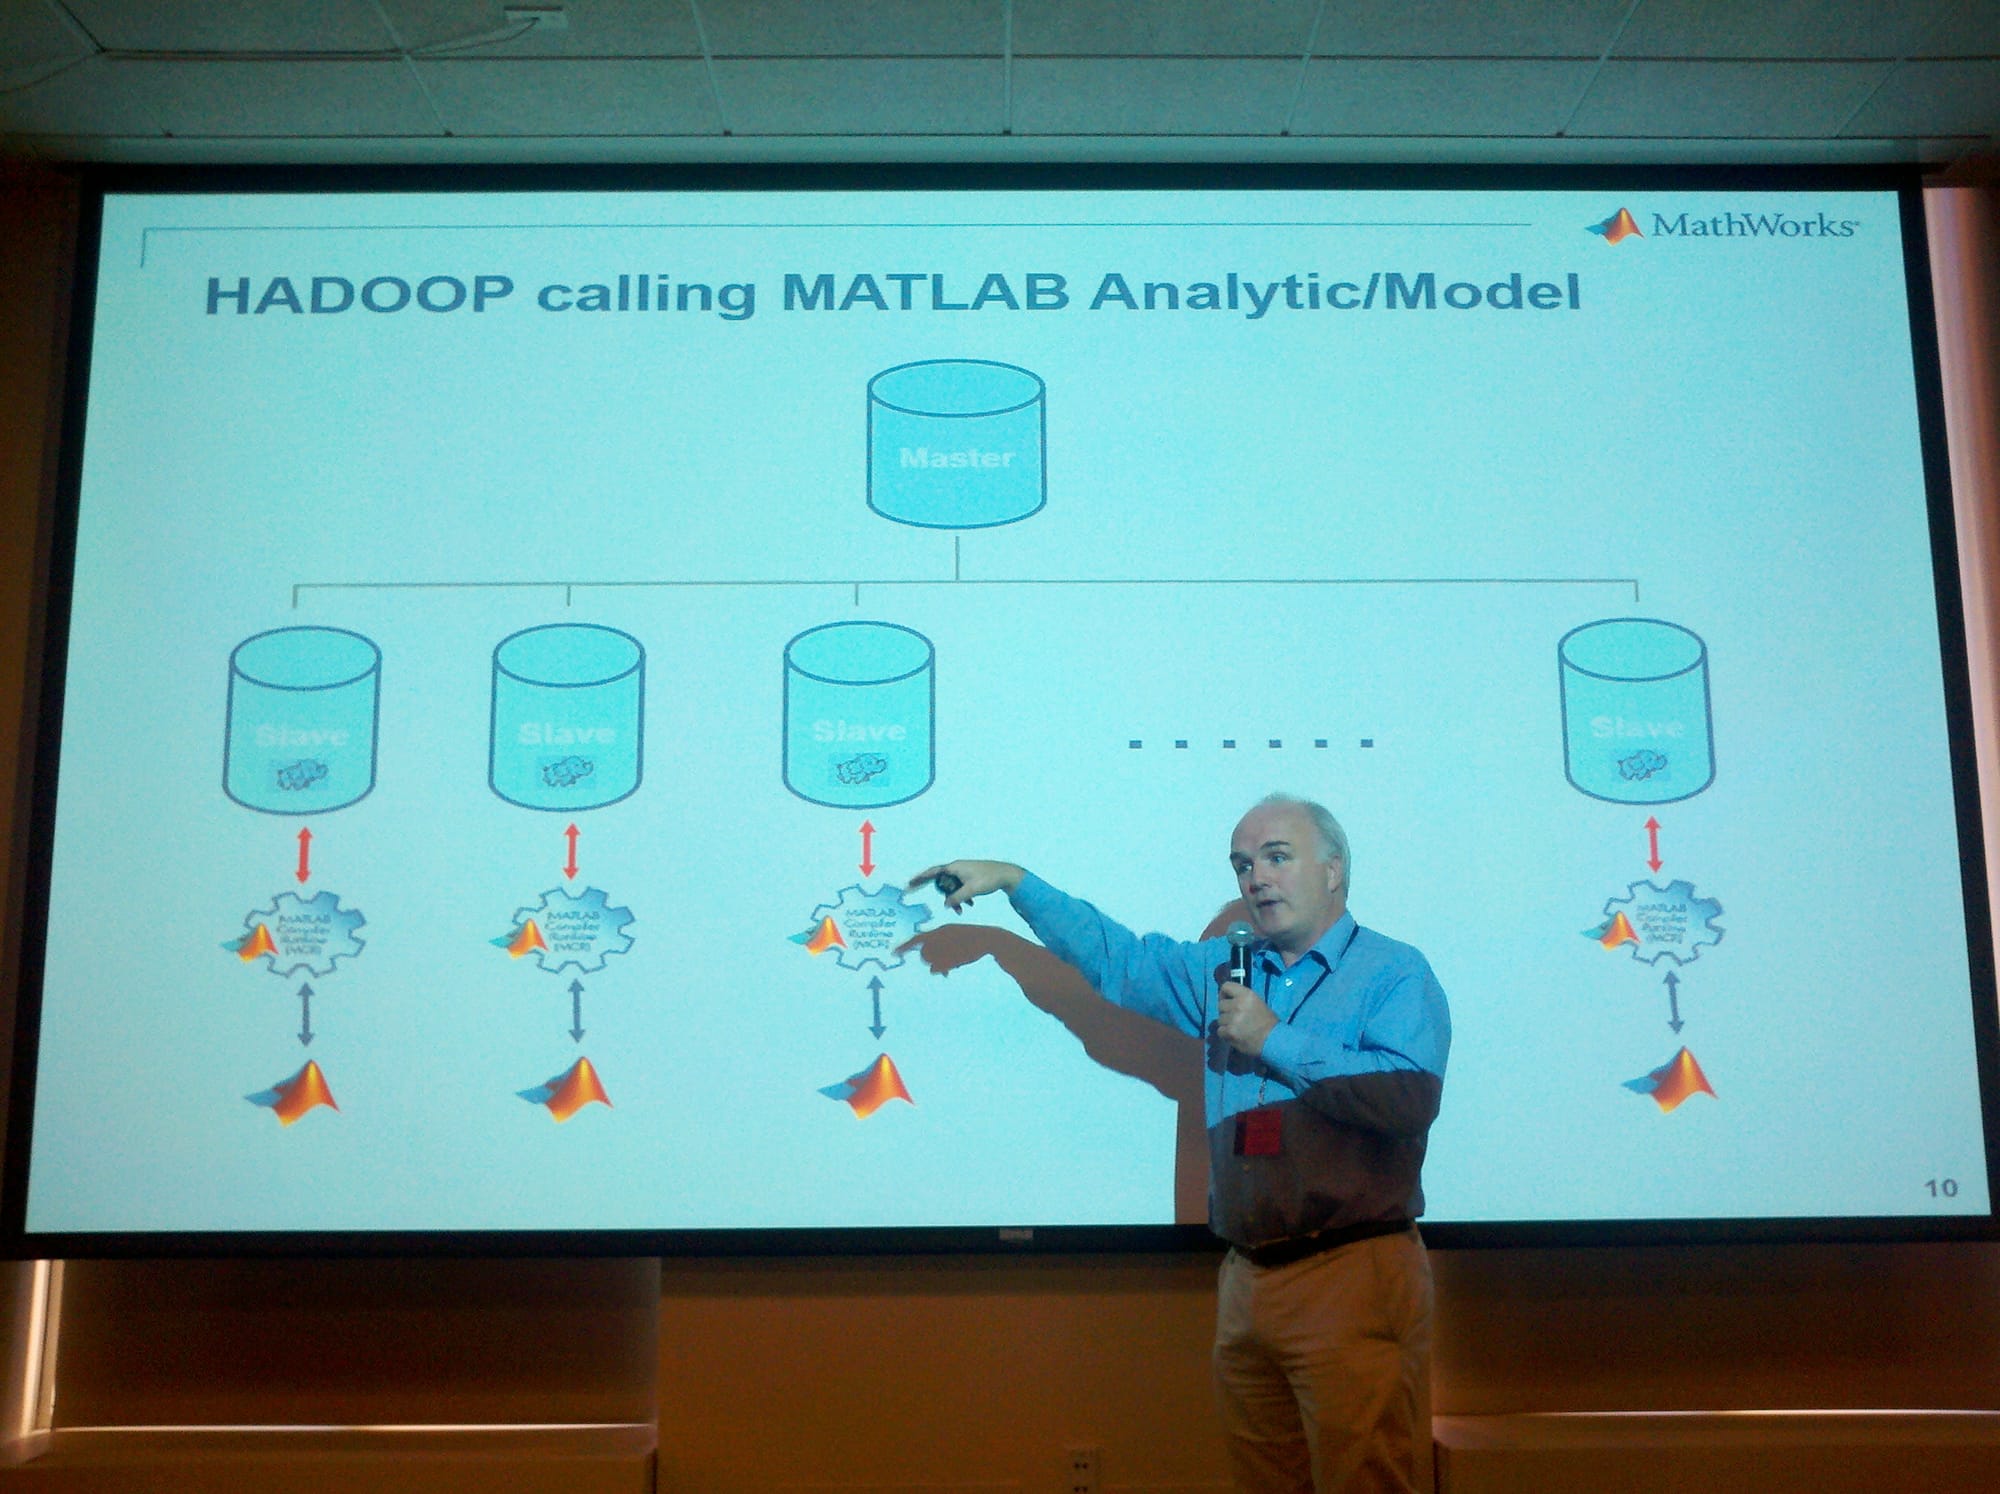
MATLAB Hadoop integration. Hadoop invoking compiled MATLAB Java components and compiled MATLAB production server components. MATLAB invoking Hadoop tasks/jobs. MATLAB Production Server is a new product in 2012. Directly deploy MATLAB programs into production. Scalable and reliable. Use with web, database, and application servers.
Eugene explained that it takes about 5 lines of code to integrate into Java, and therefore Hadoop. The Parallel Computing Toolbox is not needed to do this, so there is some cannibalization with this product. MathWorks is at the early stages of MATLAB and Hadoop integration, so there is still work to do.
In response to a question from the audience that commented it must have taken a long time to get this functionality built, the speaker indicated that it took him only about 2 months from concept to implementation to get this to work. He also siad that you do not need to do any JNI coding. Compilation needs to be performed against each platform. The latest version of MATLAB runs on Java 7.
"An Integrator's Perspective: Big Data in Finance"
"Integrators of Big Data have the advantage of implementing projects across different areas of finance, and across different functional departments in large institutions. Often the challenges are more than just technical. Hear what one integrator has to say about the challenges and the opportunities and how to successfully integrate Hadoop and other technologies into your Big Data projects."
Agenda:
– market
– services
– cases
– Jim Buonocore, Alliance Global Services
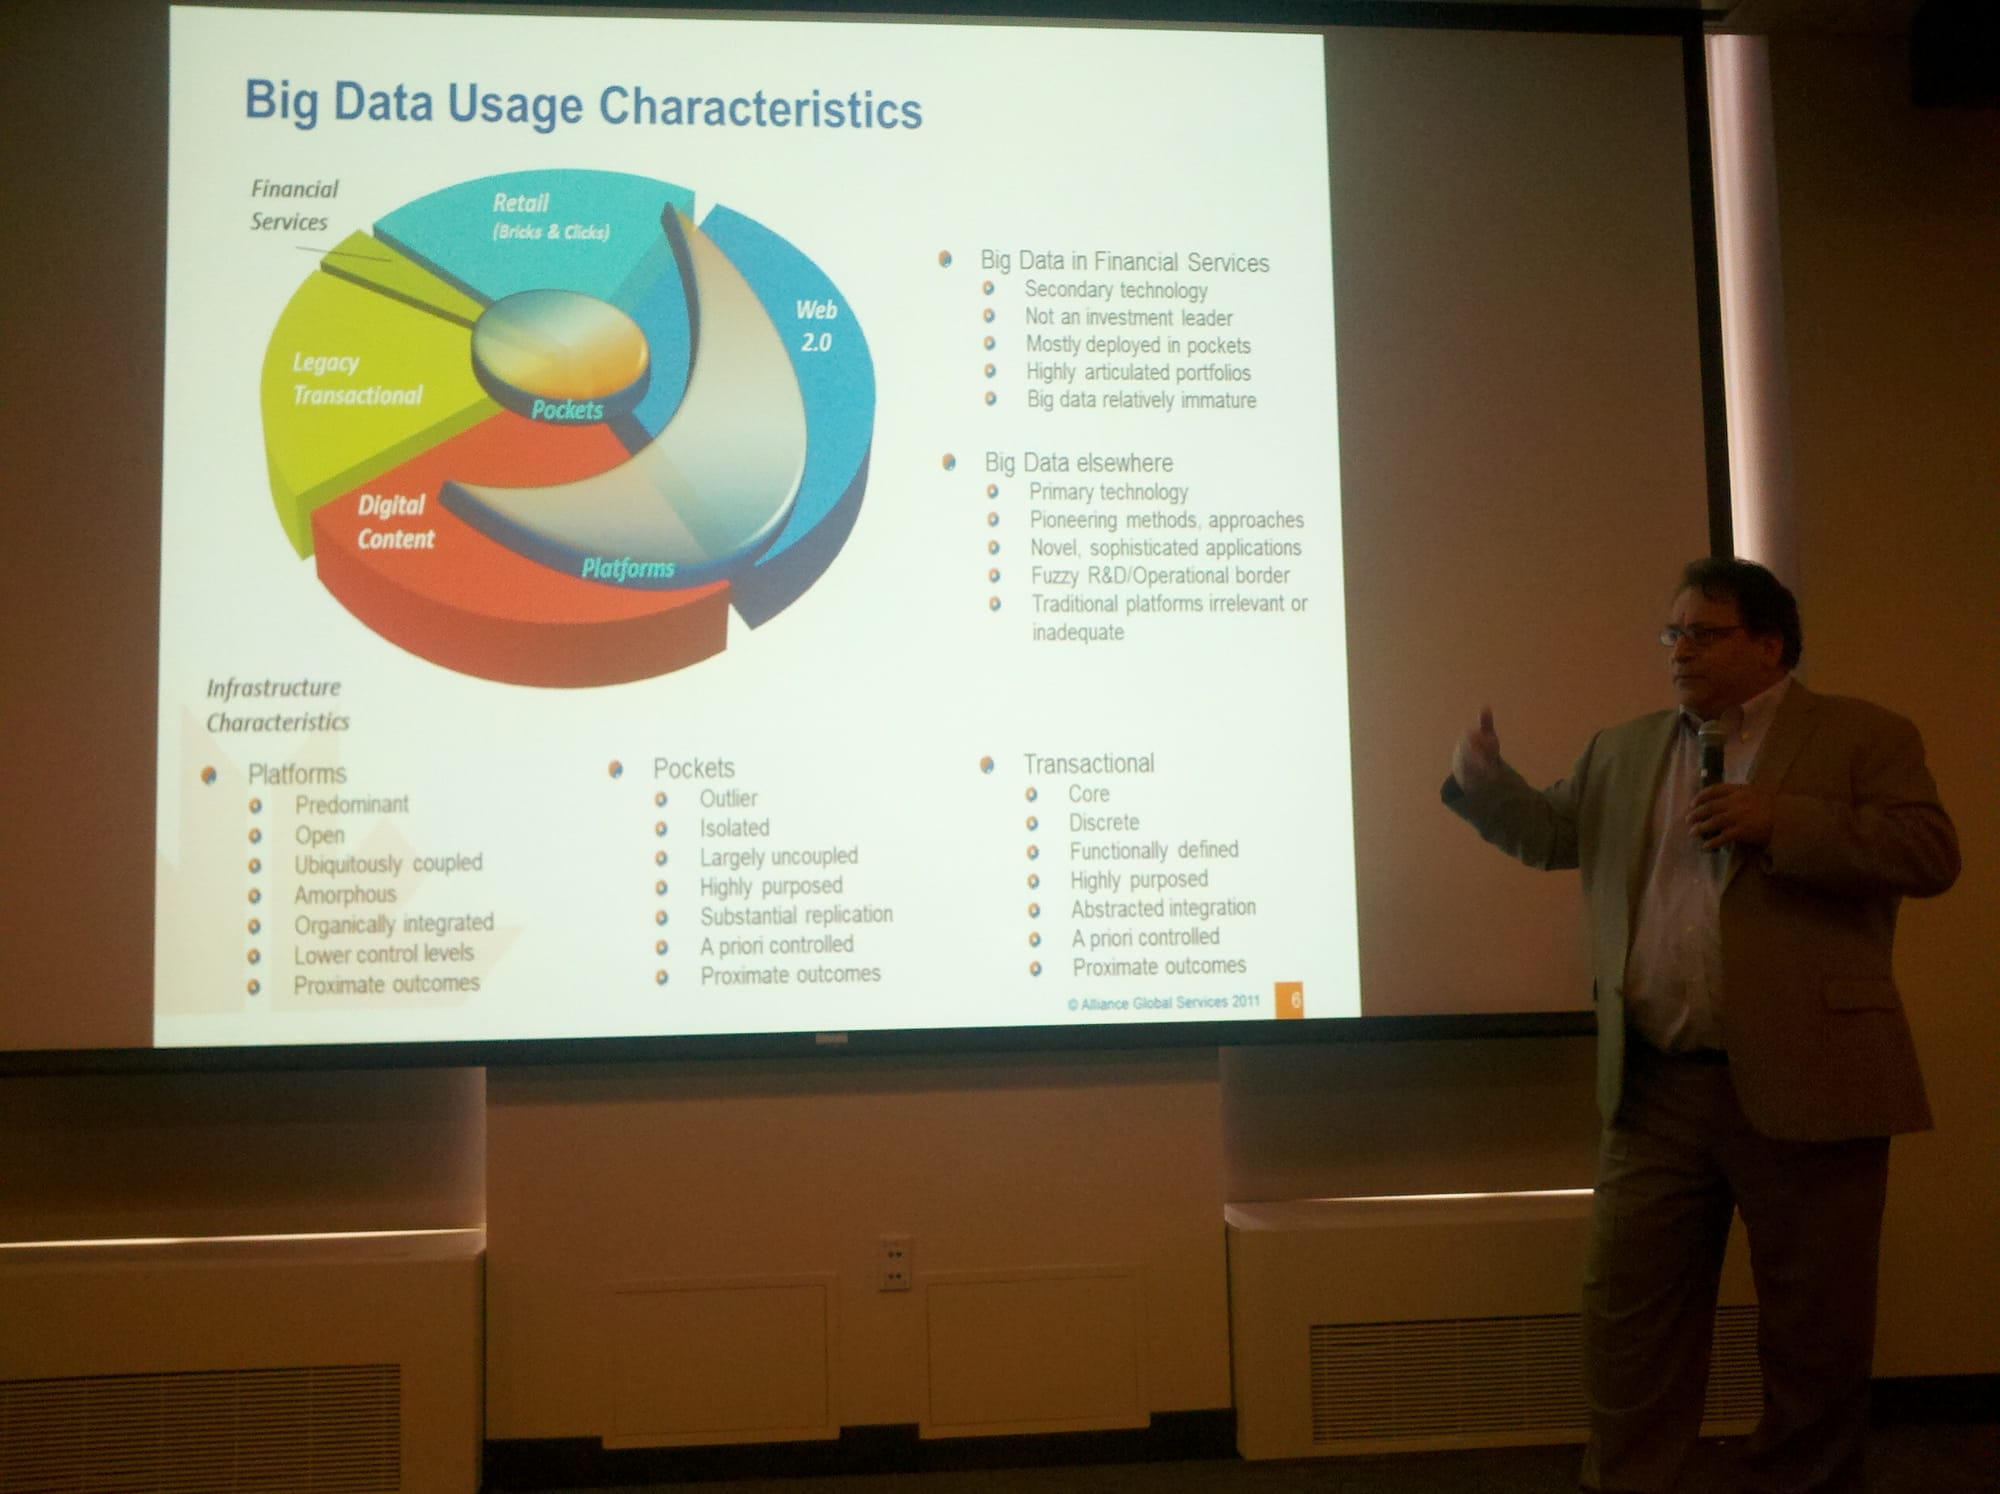
The speaker started by stating that one of the biggest hurdles on integration projects is people. Regarding Big Data usage, the top spot goes to digital content, followed by Web 2.0, retail (bricks and clicks), and legacy transactional (which includes financial services). I am not sure how the speaker defines "Web 2.0", since the term has been overused, and is a bit old.
A lot of Web 2.0 companies decide to start with Hadoop at the outset. In the legacy transactional space, Hadoop is used in pockets. Infrastructure characteristics include outlier, isolated, largely uncoupled, highly purposed, substantial replication, a priori controlled, proximate outcomes. Regading digital content and Web 2.0, Hadoop is used in platforms. Infrastructure characteristics include predominant, open, ubiquitously coupled, amorphous, organically integrated, lower control levels, proximate outcomes.
The speaker noted that much of the info he is sharing is as much fact as it is personal opinion. At Alliance Global Services, the sales team struggles to sell in some aspects, because it is not another CRM etc – it is unfamiliar territory to many.
The largest spend category is integration, followed by infrastructure and COTS products. Integration involves infrastructure connectivity, product configuration, data services, application connectivity, portfolio event management, extra-enterprise connectivity, intra-platform product placement, core build, operations.
Service providers and consulting firms typically needed. For service categories, build capacity takes the top spot, followed by tool expertise, domain expertise, operate/maintain, infrastructure, control/risk, PM/PMO, strategy, and choosing vendors.
Regarding technology directions, the current buzz is all about the platform, the technology, and differentiators. In the near term, significant growth is seen in open platforms, rapid maturation, hybrid technology stacks, heterogeneous environments, lagging growth in mature industries. Long term technology directions includes functional emphasis (platform abstraction), tool independence, commodity platform availability.
Wholesale adoption in legacy industries. Scope for all types of Big Data computing. Easier for legacy C-levels to buy function. Ubiquity. Fully integrated, tool independence, hybrid technology stacks, heterogeneous environments. The speaker went over three use cases on Master Data Management (MDM/Reference), operational performance and risk, and "post doc" research support.
"Big Data Meets Cloud: The Perfect Arranged Marriage"
"Big Data, many say, belongs in the Cloud. Hadoop will be there to receive it! This talk discusses the advantages of putting financial data in Hadoop in the Cloud."
– Abhishek Mehta, tresata
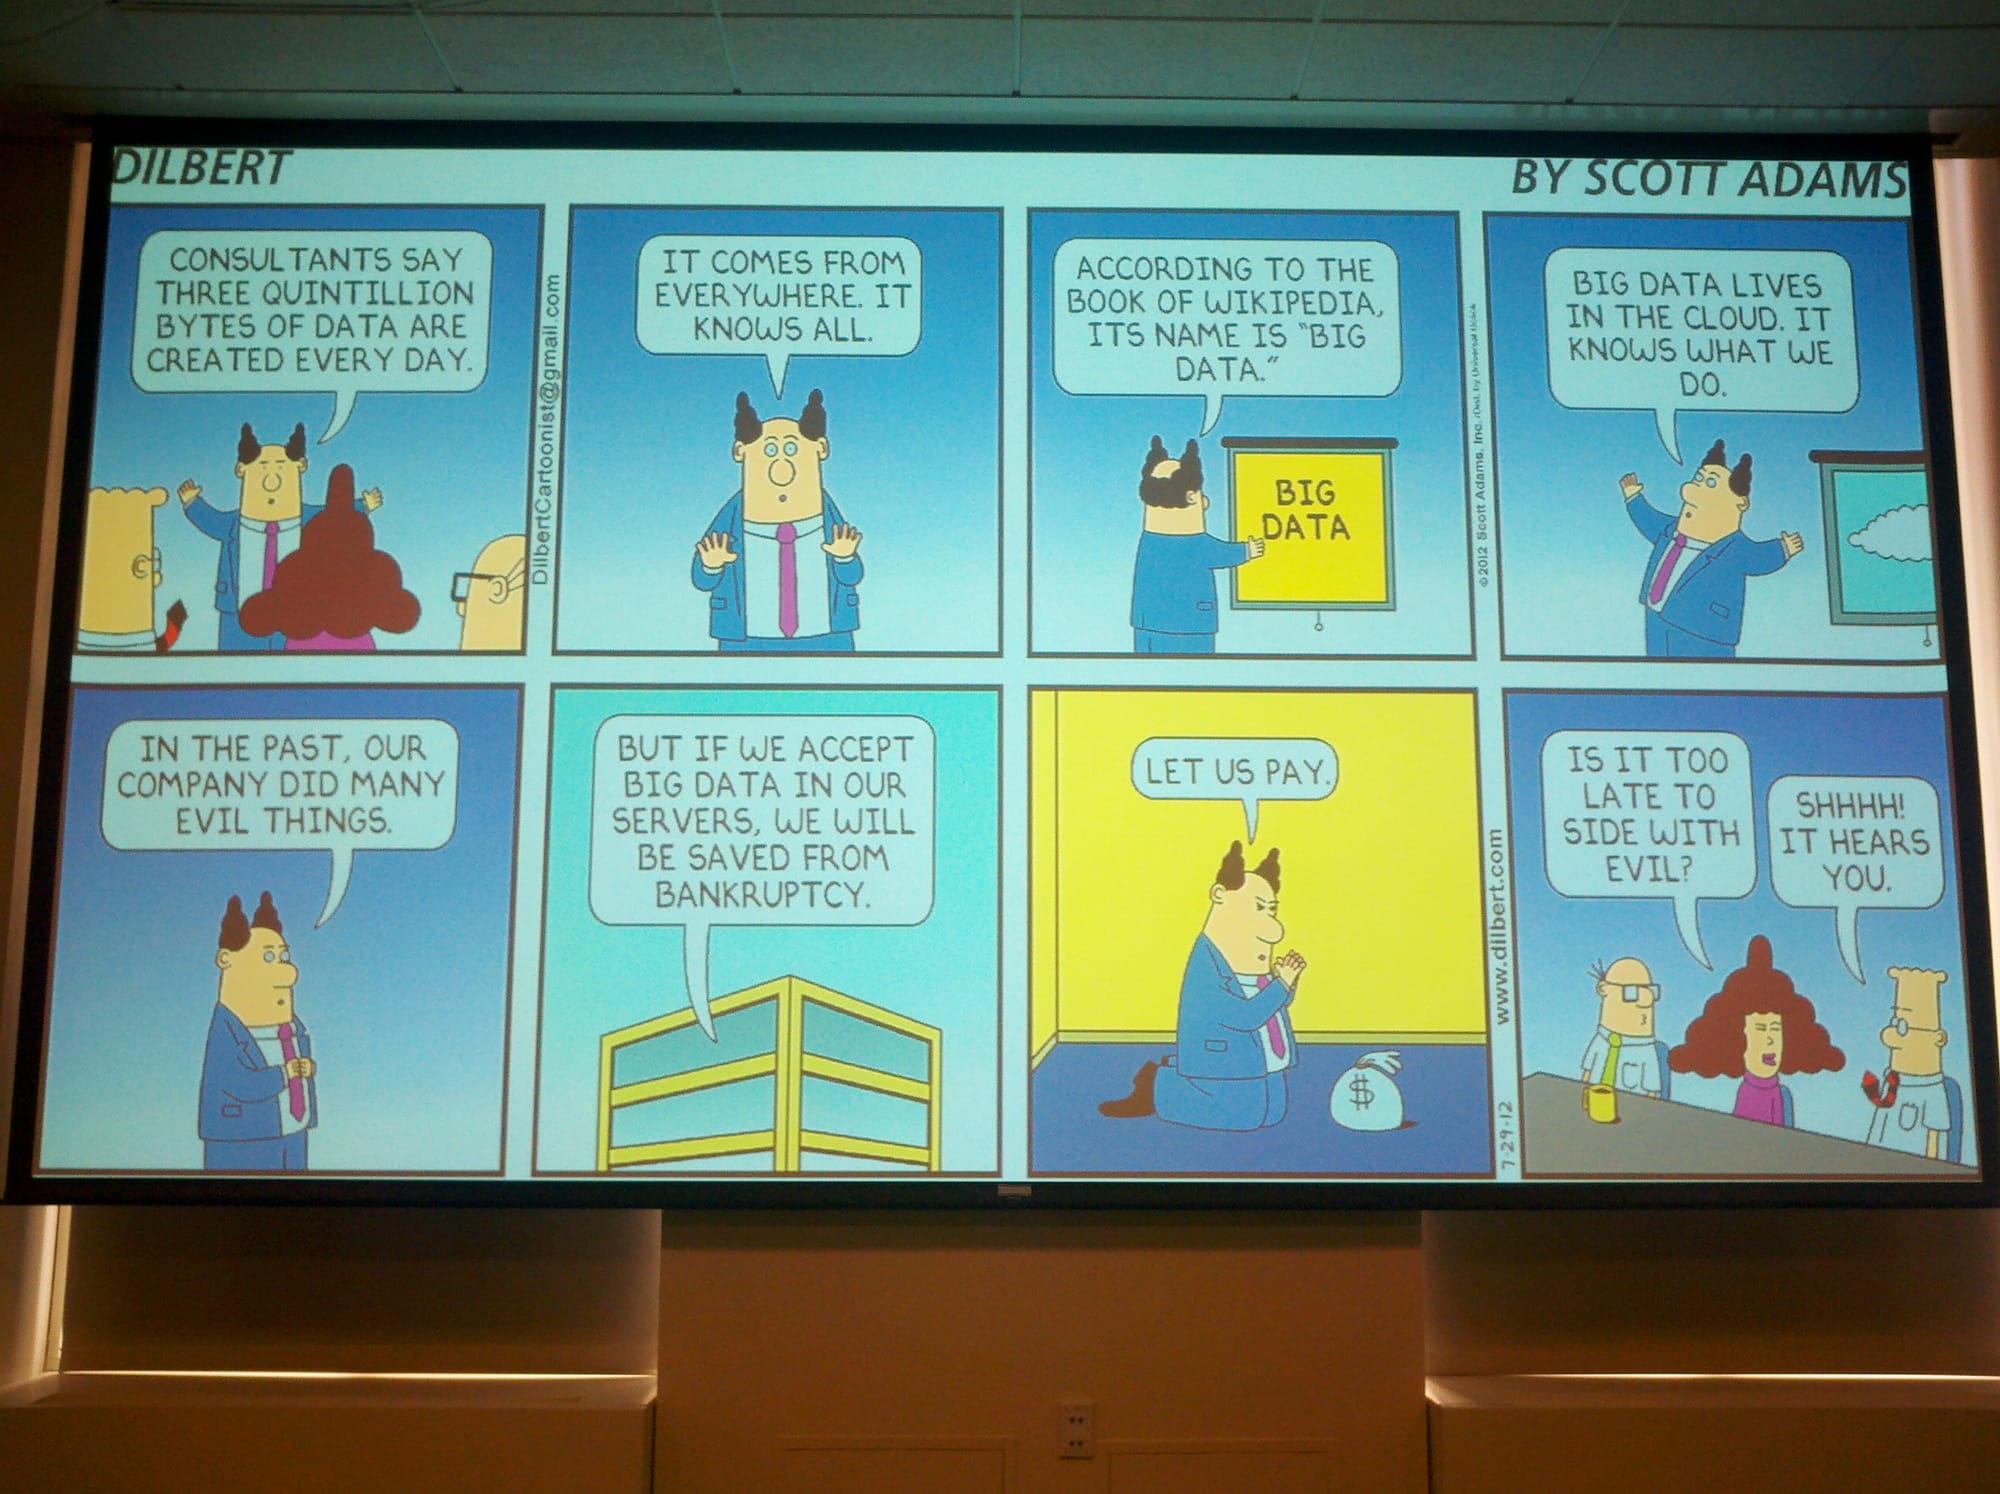
According to Abhishek, tresata is the first vertically focused Hadoop analytics company. It uses Big Data as a service business model, gaining actionable insights driven by client/market behavior.
The speaker commented that "cloud" should not be mentioned to a bank for good reasons. Take aspects of the cloud, and deliver solutions. Clients are sold by features of the cloud, such as pay-as-you-go etc, but not by the term "cloud" itself.
Acknowledge the risks. Any data privacy issues can kill you. Clients such as banks want to keep their data separate. Interoperability bringing more accurate predictions does not apply, because interoperability is not an option. "You can watch, you can touch, but can you keep?"
In the B2B space, client data is not owned by tresata, but if data is combined from multiple sources to create something new, it does own it. The speaker tells clients that data is always owned by them, but the software is not.
The concept of the cloud must handle situations where data is constrained to live in certain countries, such as Luxembourg, where data cannot leave the country. The speaker commented that most of the issues he discussed during this session go away if data is anonymized. If data sits within own firewall, anonymization is not a requirement. Consumer data has been sitting in the cloud for years, such as consumer data used to calculate FICO scores.
Abhishek posed the question: What is the purpose of you moving into the cloud? He commented that for analytics, one needs to be careful. You need to ask questions around privacy and ownership. On the B2B side, the rules are fairly clear, but on the B2C side, these are not.
There is a demographic aspect that cannot be controlled. There is also an educational aspect, which is lacking with regard to "free" services. With "free" you always have to give something up. The race that is going on is how much data you can bring to the problem, but the problem is how you do it.
Panel Discussion
"Viewpoints, opinions, and Q&A with a panel of experts."
Tom Groenfeldt, moderator
Slim Baltagi, CME Group
Adam Gugliciello, Datameer
Andrew Paul Acosta, Milesius Capital Resources
Abhishek Mehta, tresata
Krishna Nimmagadda, MetaScale
Tedd Dunning, MapR Technologies
Wen-Ming Ye, Microsoft
Ari Zilka, Hortonworks
Carmen Taglienti, BlueMetal Architects
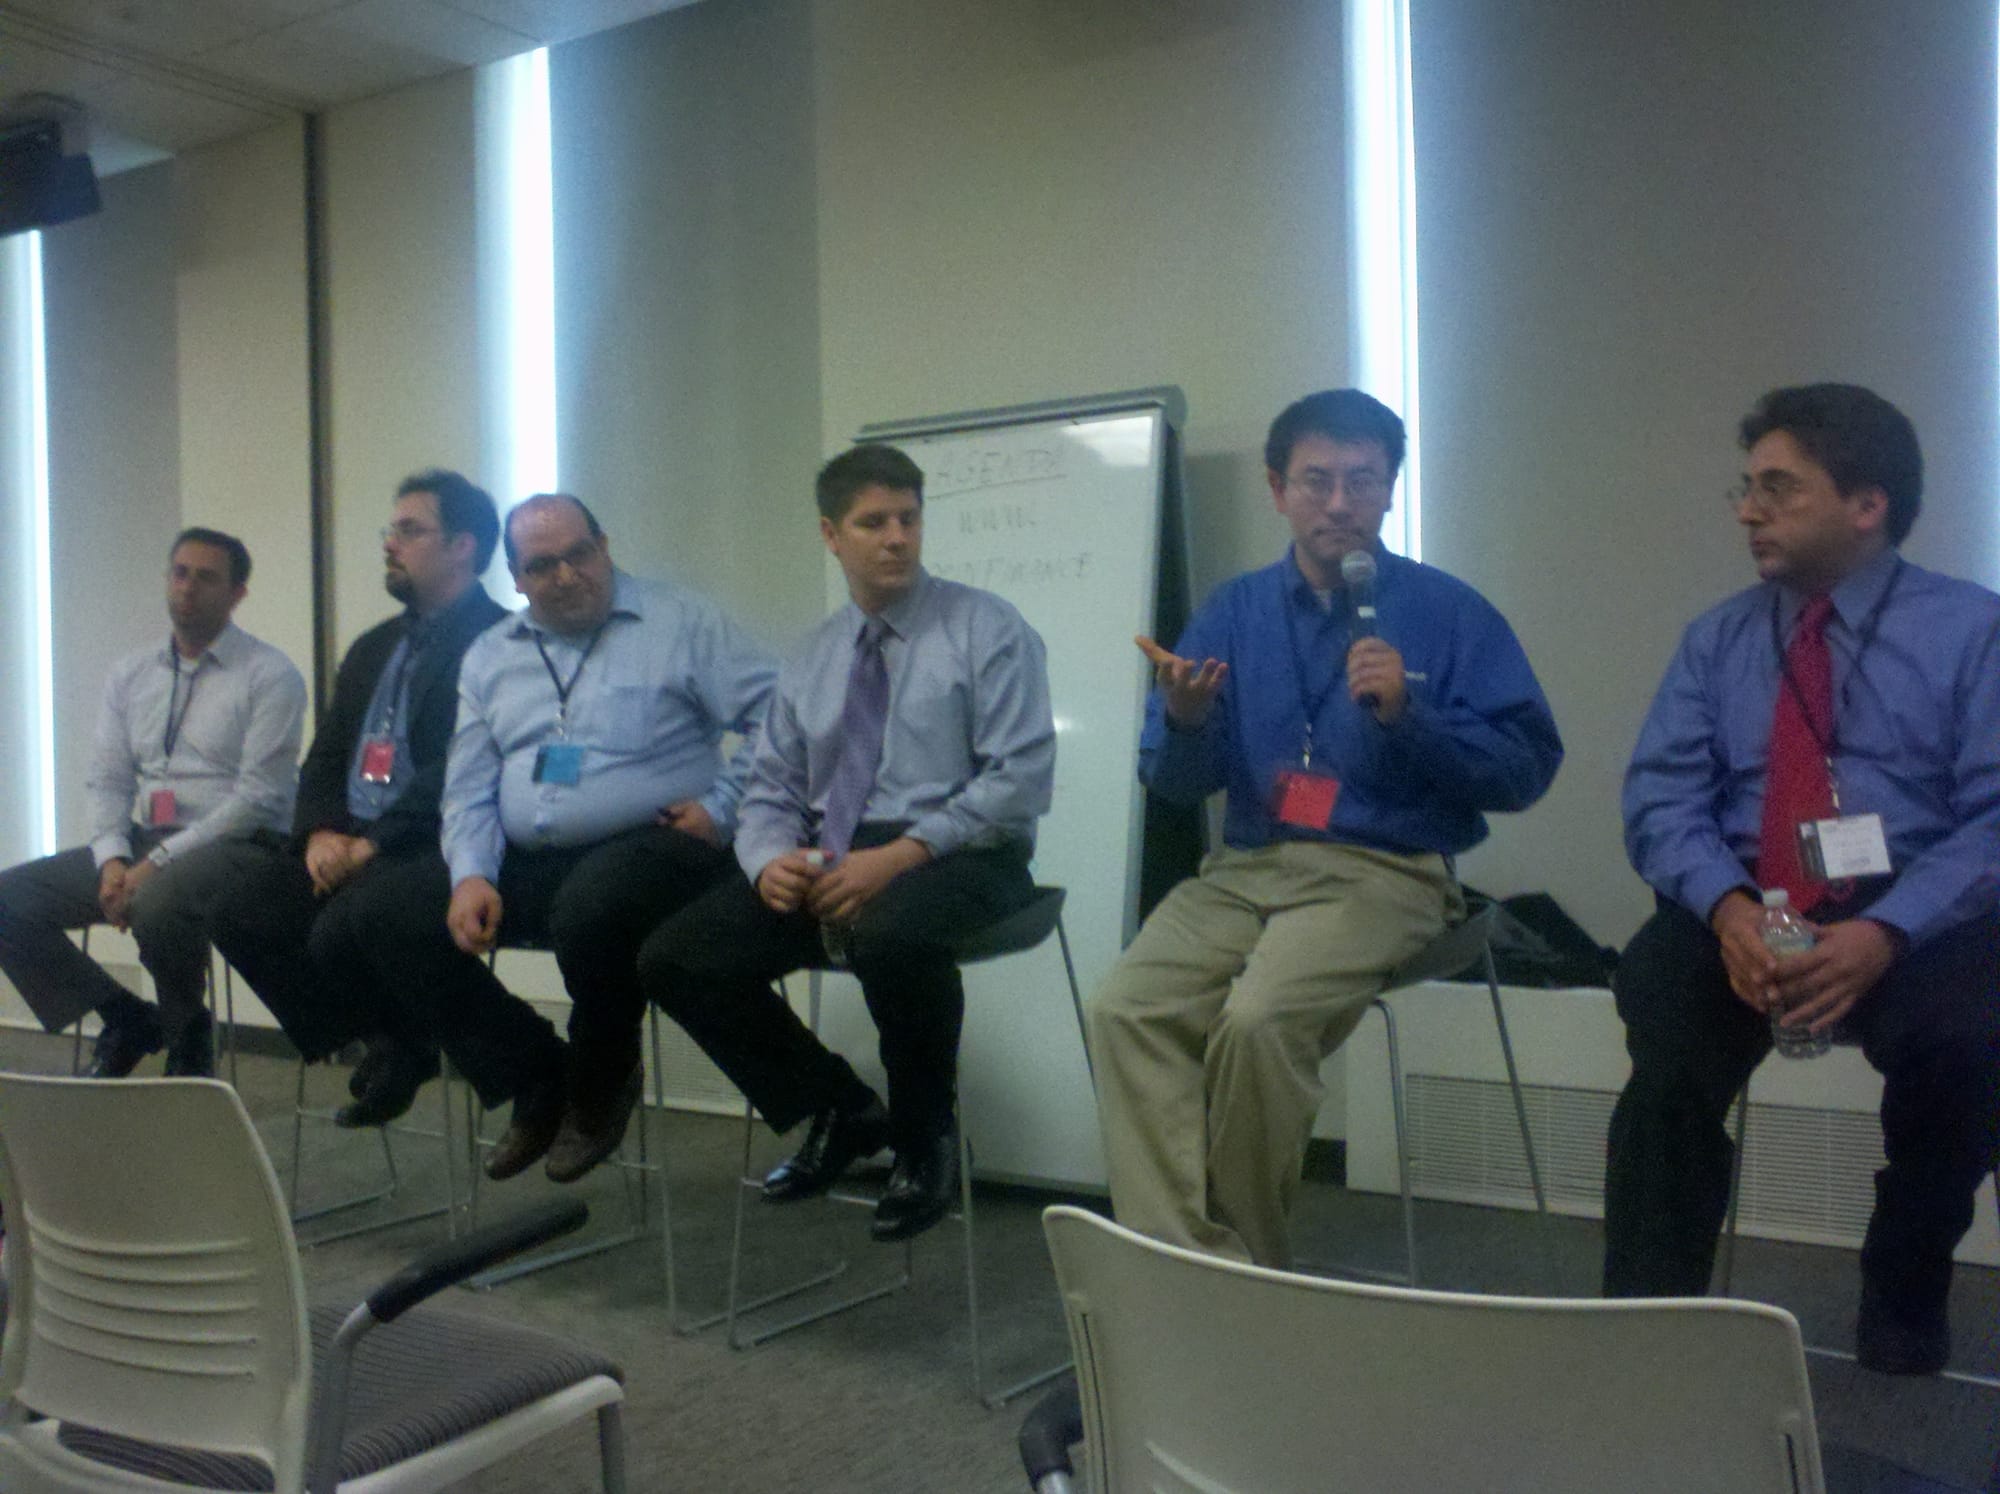
The moderator started this discussion by asking: What is it with Big Data that is so new that we couldn't do before? What is my ROI? A lot of banks have 40 or 50 systems that don't even know what they have, so the first step is to make this determination. Do you see anything that will change the world?
Ari Zilka, Hortonworks: Every single vertical can now do data retention, we're not leaving data on the floor, and we're doing full table scans.
Adam Gugliciello, Datameer: I'm not seeing anything yet, but the death of the star schema, the ERD, etc are dying. If you're not storing normalized data, you can look at the original data.
Slim Baltagi, CME Group: There is now the opportunity of doing more with data, away from traditional data silos, and the opportunities to do realtime work are increasing.
Andrew Paul Acosta, Chief Data Scientist, Milesius Capital Resources: Now it's about business value. We ask executives what they would like to do if they were not constrained by master data models etc.
Wen-Ming Ye, Microsoft: Human creativity is driving innovation, beyond what technology is able to do for us.
Carmen Taglienti, BlueMetal Architects: Moving forward, more firms will be using more data, especially in regard to sampling, where all the data can be used, not just samples.
Krishna Nimmagadda, MetaScale: Clearer ROI models will help enable funding when you're offering predictions that will drive revenue etc.
Abhishek Mehta, tresata: Every model (predictive etc) that has been written will be rewritten.
Tedd Dunning, MapR Technologies: Reducing costs is not going to change anything, but growth patterns will.
How do you go about selling and explaining Big Data?
Slim Baltagi, CME Group: Took approach of almost begging from department to department, and got them more involved. Manager did a good job at going to upper management. It is human nature to be resistant to change.
Ari Zilka, Hortonworks: I don't sell Big Data or Hadoop. The line of business wants to answer certain questions, and Hadoop helps answer those questions. In general, the goal is not to oversell. I don't educate on Big Data, they educate me.
Abhishek Mehta, tresata: A massive driver is the fear of being left behind. Greed is another driver, as is economics.
Krishna Nimmagadda, MetaScale: (Didn't really answer the question.)
Tedd Dunning, MapR Technologies: (Went off on a tangent to respond to Abhishek Mehta, who said that social media cannot be predictive.)
Abhishek Mehta, tresata: Responded to Tedd by saying that he didn't say social media cannot be predictive, but that the models have not been written yet.
Tedd Dunning, MapR Technologies: Explained why Abhishek Mehta is wrong, and gave examples of models that have already been written.
Wenming Ye, Microsoft: Demos or POCs can be used to demonstrate the value of Big Data. At Microsoft, one problem is that they already have a lot of in-house solutions, and the question is posed as to why they should invest any more money in this area.
"OK, So You've Decided to Put Data in Hadoop. Now what?"
"This talk covers some of the issues you will face as you move data to Hadoop and manage it there. Also, you need to integrate Hadoop with other data (because not everything belongs in Hadoop), and this talk discusses the challenges and solutions of integrating with legacy data."
– Dr. Phil Shelley, Sears Holdings, CTO, and MetaScale, CEO
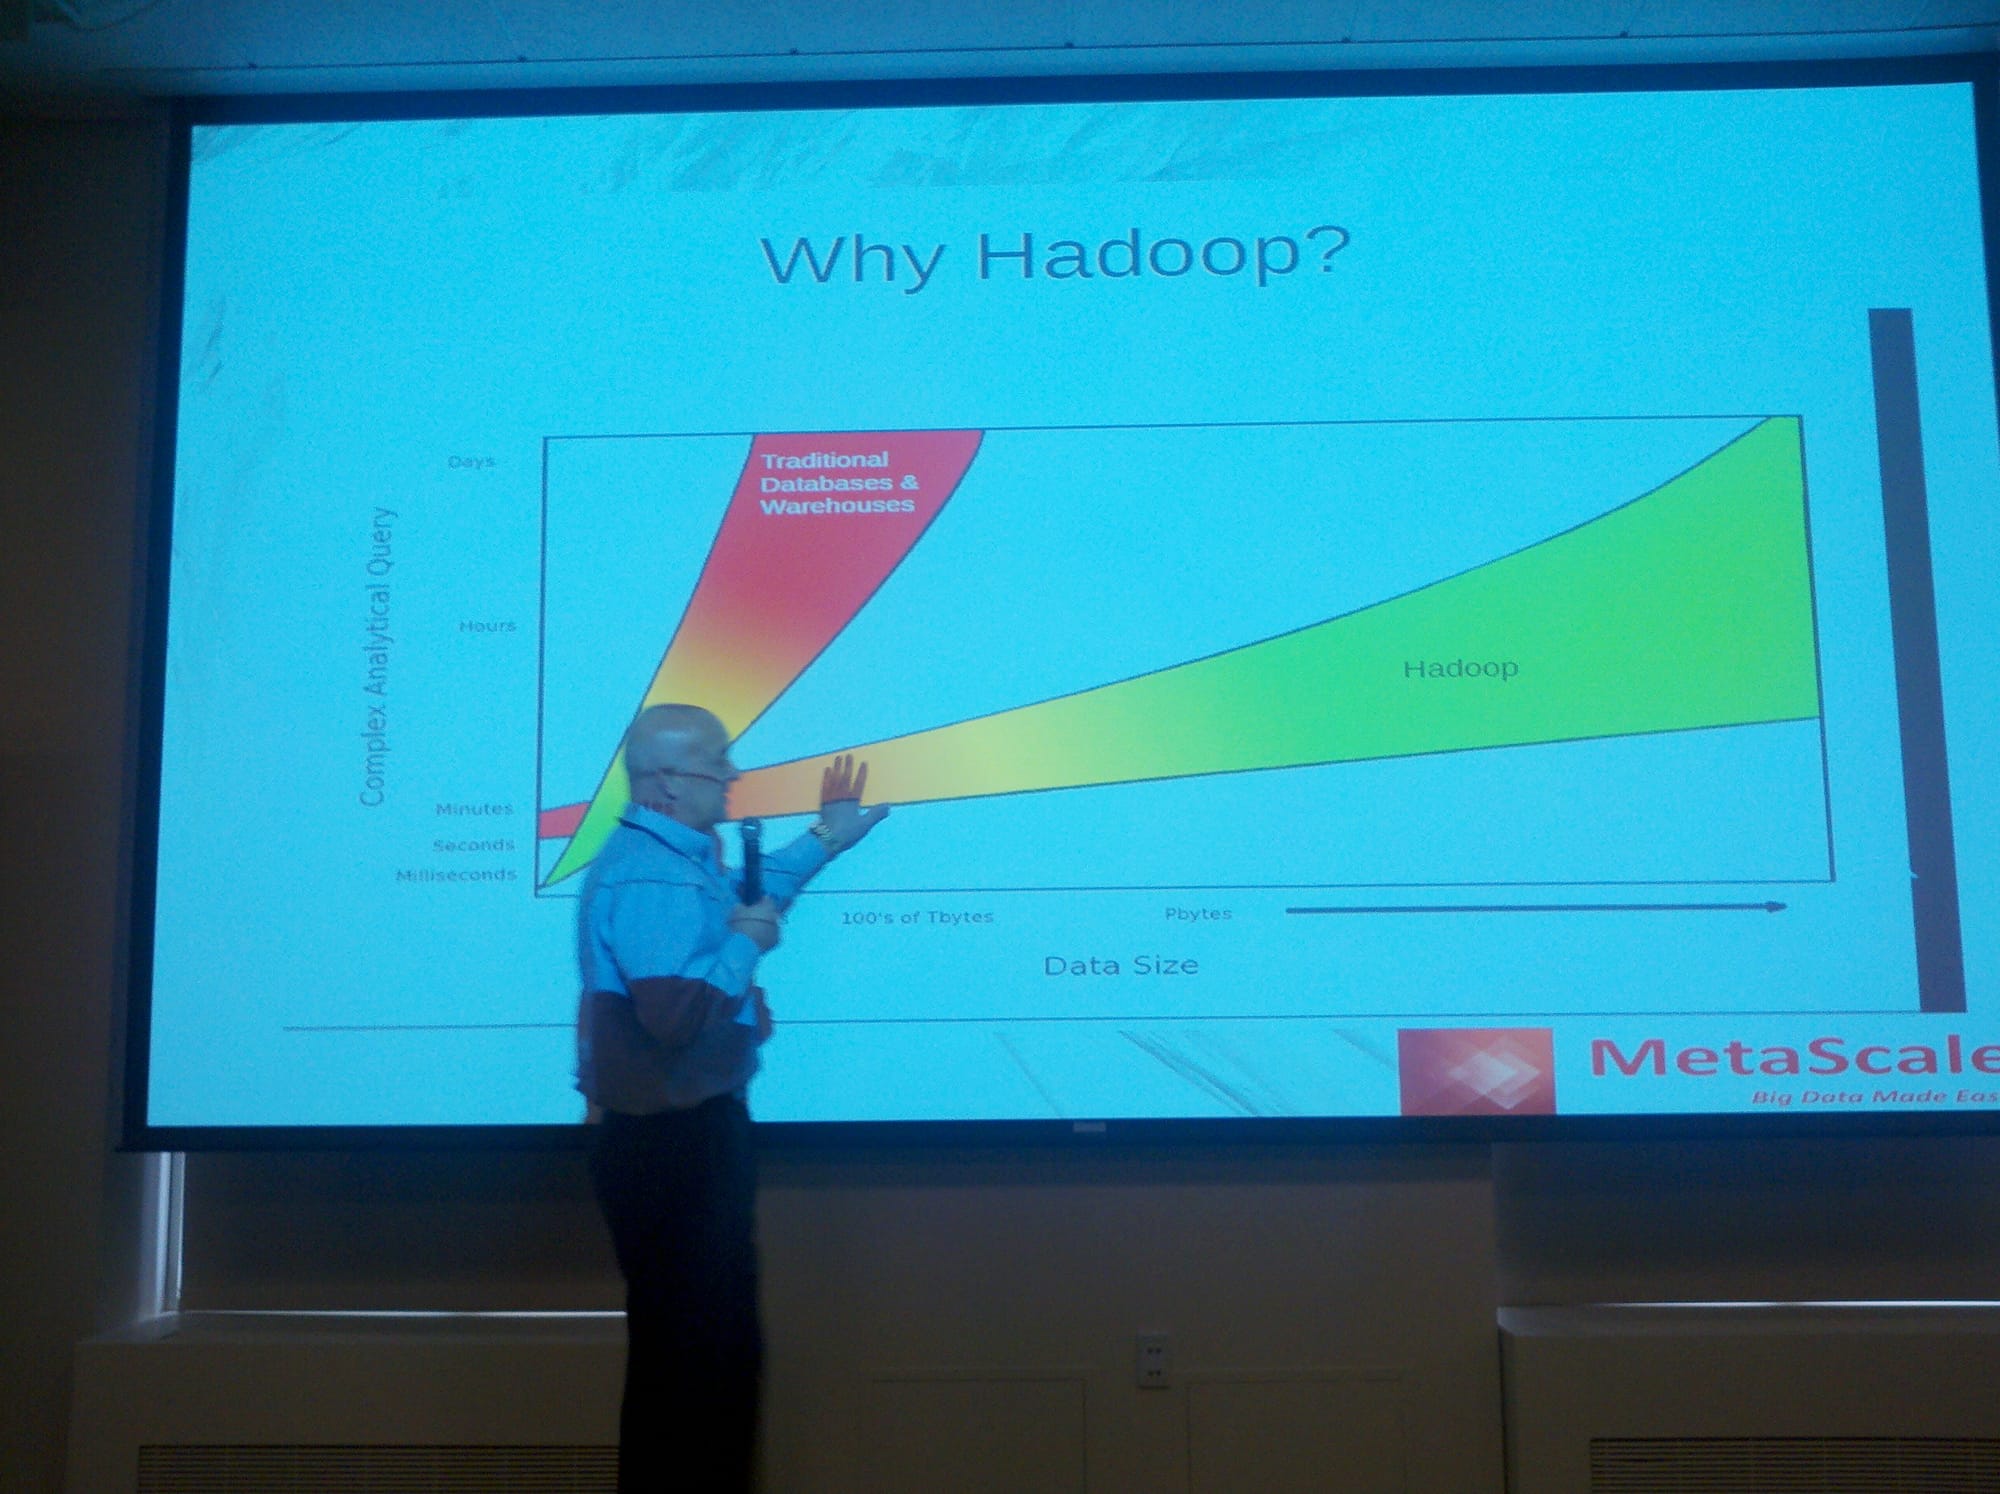
Dr. Phil Shelley, CTO of Sears Holdings and CEO of MetaScale, started his presentation by indicating that Sears Holdings has about 4k stores in the United States. They wanted to do things with data that they could not do, such as loyalty programs etc, pricing algorithms based on inventory etc. Reports were being generated with Teradata on a quarterly basis that took 6 weeks to run. The business wanted to start running these reports weekly.
They were having issues with meeting production schedules. Multiple copies of data, no single point of truth. ETL complexity, cost of software and cost to manage. Time to take to setup ETL data sources for projects. Latency in data, up to 2 weeks in some cases. Enterprise data warehouse unable to handle load. Mainframe workload over consuming capacity. IT budgets not growing, but data volumes escalating.
Phil commented that a solution always involves an ecosystem, so you are not going to solve all your problems on one platform. Sears Holdings has a huge sprawl of products in this space because you cannot put them all in one place.
Keeps about 90 days of data (consisting of box scan data etc) within Teradata. Regulators need 10 years, but it is cost prohibitive to keep all of this data in Teradata. There are speed, storage, and cost factors. It does not make sense to store everything in Teradata when you are only going to query it once in a while. With Hadoop, it is now economically feasible to do this. The single point of truth is now a reality with Hadoop, only moving data when you need to do so.
Sears Holdings has an ESB for point of sale transactions etc. Half of the workload still originates in mainframes. Short 5-minute batch Hadoop jobs are run throughout the day from credit card transaction systems. What they have focused on is a single point of truth for analytics. The speaker pointed out that they do not allow any more new ETL.
About 10 hours of ETL have been reduced to 17 minutes with Hadoop, and if there is a failure, they just rerun. About 5k lines of COBOL have been replaced with 300 lines of Pig. Much more maintainable. Some IT projects have paid for themselves within a year. Some even in a month. Phil commented that he has never seen results like this before. In some cases, the cost of 1 MIPS is $10k per year, so for a system with 10k MIPS, he commented that it is not that hard to see the cost savings when transitioning off of a mainframe.
Rethink everything. The way you capture data, the way you store data, the structure of your data, the way you process data, the way you analyze data, the costs of data storage, the size of your data, what you can analyze, the speed of analysis, the skills of your team. The speaker mentioned that he has some folks with 30 years of mainframe experience that worship the mainframe, and this has been an eye-opener for them. Companies need to experience these capabilities themselves.
A number of lessons learned at Sears Holdings. Big data tools are here and ready for the enterprise. You can move mainframe workload to Hadoop and run jobs up to 50 times faster! You can mostly eliminate ETL with Hadoop. An enterprise data architecture is essential. Hadoop can handle enterprise workload, reduce strain on legacy platforms, reduce cost, and bring new business opportunities. The solution must be an ecosystem, part of an overall data strategy, and must not be underestimated.
Cubing is no longer needed. Data is just read and aggregated when it is needed. It took his team about 2 years to move to Hadoop. They used to use SAS on the mainframe, and now use R and Hadoop. The folks using Hadoop etc at Sears Holdings were retrained, and all these folks came from in-house. Brighter data architects and developers took about a year to get up to speed.
The reason they went with Datameer for part of their ecosystem is because it is a good way for people to explore data, without the limitations of Excel etc where you cannot import 100TB of data when running a query.
Slim Baltagi from CME Group chimed in from the audience and said that he disagrees that these tools are 100% enterprise ready, and the speaker said that they make it work. Hadoop is the first tool that provides a real data hub where data can be stored and analyzed in the same place. A type of ETL is used, but without the E and the L.
"Scalability in Hadoop and Similar Systems"
"Wherever you store and analyze your financial Big Data, scalability and performance is key. Hadoop scales and performs well out-of-the-box, but there is much you can do to make the most of your hardware and improve both scalability and performance."
– Ted Dunning, MapR Technologies
Note that Ted gave a great presentation that was essentially the same as the one he gave at BigDataCamp Chicago, so I took very few notes during this session. In my opinion, this presentation is very compelling – one of the best at both events.
Why Big Data now? If it were just availability of data, then existing big companies would adopt big data technology first, but they did not. If it were just a net positive value, then finance companies should adopt first because they have high opportunity per byte, but they did not. Under almost any threshold argument, startups would not adopt Big Data technology first, but they did.
Someone from the audience commented that Hadoop does not solve all problems. Ted responded by saying that the fact that the facts that Hadoop does not like to connect and does not like mashups can be remedied, and the fact that Hadoop does not like realtime can be remedied. Someone else suggested that Hadoop will disrupt free markets, but Ted responded by saying that this is already being done. Anyone who can disrupt free markets is the new status quo.
Ted furthered in his responses to audience comments by saying people have observed that the law of large numbers does not always work. This has been observed many times, but people keep going back to normality and ignore the theories. We are definitely communicating at a level we have never been able to do in the past.
"Scaling Out Excel Using Windows Azure and Hadoop"
"Excel is the de facto front-end choice in finance. From the trading desk to the risk department, Excel is ubiquitous, and for good reason: it is a data analysis tool that everyone knows how to use. This talk shows how to use Excel as a front-end to Big Data in Hadoop for financial analysis."
Agenda:
– Excel and Hadoop on Windows Azure
– Excel 2013 with PowerPivot and PowerView
– Excel compute with Windows HPCS (HPC Server), Windows Azure
– Wen-Ming Ye, Senior Technical Evangelist at Microsoft
Wen-Ming started the presentation by commenting that you can try out online what is probably the only currently available free Hadoop cluster: www.hadooponazure.com
The speaker went over at a very high level the following, all centered around Microsoft technologies: HPCS (burst/cloud numerics runs on top of HPCS), the Microsoft distribution of Hadoop, data mining/predictive analytics, data marketplaces, PowerPivot (Excel self-service analytics), PowerView (Excel 2013 data visualization), and business intelligence: analytic services and reporting services (SQL Server).
An ODBC driver is available for Hive, as well as a Hive add-on for Excel and integration with PowerPoint. A Hadoop based distribution for Windows Server and Azure is available through a strategic partnership with Hortonworks. A JavaScript framework for Hadoop is also available from Microsoft.
The speaker gave demonstrations of http://www.hadooponazure.com, using Excel to access Hadoop with Hive, Excel 2013, and HPCS. Wen-Ming commented that for Big Data, make sure you get the 64-bit version, and that PowerView was really made for nontechnical business users. (The speaker went through this material quickly, so I did not have enough time to get down more notes.)
"Data Analysis with Hadoop"
"Analysts are increasingly interested in new types of unstructured data – sentiments expressed online, and text from newswires and social networks, and others. Exploiting these new data sources is leading to new insights and new business opportunities. Hadoop forms a data 'refinery' that when integrated with traditional data warehouses and using Hadoop's ecosystem of analytical tools unlocks patterns that underly the data."
– Ari Zilka, Chief Products Officer at Hortonworks
Ari mentioned that he was also the founder of Terracotta, a low latency Big Data platform, about which I saw him speak at SpringOne 2GX 2010.
Integration with traditional data warehouses is what Ari mentioned was the key for this session of the event. Within 30 to 45 days, we should hear about the Microsoft and Hortonworks collaboration, but he indicated that he would not discuss during this event. As Rick Fath from CME Group indicated in an earlier session, "Big Data = transactions + interactions + observations". Companies that can connect data between storage silos can unlock a lot of insight.
The speaker briefly discussed three patterns: Refine, Explore, and Enrich. The Refine pattern looks at the data and sees something new that had not been seen before. With the Explore pattern, questions start being asked, and with the Enrich pattern comes better predictions.
The Refine pattern is an operational data refinery, and data needs to be cleaned as soon as possible. Ari gave an example of a "Big Bank" service with two users and a pipeline, with 10k files being dumped every day to GPFS, the IBM clustered file system. According to the speaker, using GPFS as a refinery was not so good, because it only contained 1 day worth of data that was initially imported (only 1/20 of the columns) directly to Teradata. HDFS was brought in to store 3 to 5 years of data rather than 1 day, and connected to Vertica, Aster, Palantir, Teradata etc that detected and uploaded only changed records in HDFS.
With the Explore pattern, Hadoop is used as an agile, ad hoc data mart. An example was given of a hardware manufacturer unlocking customer survey data (think SurveyMonkey). Survey data was joined with CRM data etc. The Enrich pattern delivers results of a Hadoop analysis to online apps. An example was given of the visits to custom web pages of a clothing retailer. Hadoop was used to perform cluster analysis of this data stored in HBase.
The speaker also mentioned some Aster and Hadoop patterns in analytics that covered path analysis, text analysis, statistical analysis, segmentation, marketing analytics, and data transformation. (The speaker went through this material quickly, so I did not have enough time to get down more notes.)
Ari indicated that the most challenging aspect of working with clients is that companies trying to adopt Hadoop are infighting. Everyone wants to claim that they solved problems with Big Data, and some want to make sure that solving Big Data does not box them out of their jobs. According to the speaker, everyone with whom he has discussed Hadoop adoption have had success with it.
"How VoltDB is Making Hadoop a More Productive Tool for the Enterprise"
"Boost Hadoop by deploying a high-performance in-memory database and real-time analytics into the data pipeline."
– Scott Jarr, VoltDB Cofounder
At the outset, Scott pointed out that he is going to take away three things from this event, as opposed to the last one held in New York City: (1) we are seeing a lot of commonality, thinking about things the same way, (2) we are saying there is an ecosystem, which shows a level of maturity because we recognize that there is not a single solution to all problems, and (3) velocity was talked about in terms of realtime.
The speaker indicated that he believes Big Data is a rare, transformative market, that velocity is a huge problem, that specialized databases working together are the answer, and that winning solutions will create customer value fast. Scott walked attendees through the data value chain. As data ages, the value of an individual data item decreases in value. As data ages, the value of aggregate data increases in value.
It was pointed out that sometimes we say we are not creating silos of data, but we really are even with data warehouses. But the silos are different, based on who is looking at the data, such as interactive and realtime analytics, historical reports and analytics, and exploratory analytics.
If you can solve a problem with something you have now, go ahead and solve it. Bring in Hadoop etc to solve problems that cannot be solved with what you currently have. It is not enough to capture massive amounts of data. Organizations must also sift through the data, extract information, and create actionable data.
Scott walked through a few case studies, including high throughput, relentless data feeds, fast decisions on high value data, realtime, operational analytics that present immediate visibility, and the movement of processed datat to a volume platform. (The speaker went through this material quickly, so I did not have enough time to get down more notes.)
"Raw Data to Real-time Decisions: Feedback Loops Using CEP and Hadoop"
"Business intelligence solutions can leverage CEP (complex event analysis) with Hadoop to make informed decisions in real-time from operational and transactional data. Tools in the Hadoop ecosystem such as Hive and Mahout allow you to perform in-depth analysis using the full fidelity raw data to modify queries to adapt to changing business needs and newly discovered patterns."
– Carmen Taglienti and Phil Young, BlueMetal Architects
BlueMetal Architects was founded in 2010 by former Microsoft executives.
The speakers began by discussing the fact that there really is a lot of overlap between the financial world and other domains, but also walked through a list of what they see as the top-10 challenges in this space: regulatory change, restructuring, globalization, data management and analytics, risk management, technological innovation, privacy and information security, business performance, customer loyalty, and talent retention.
Hadoop is great for what it does, but sometimes it is a big hammer. What is the maturity of the company considering usage of Hadoop? What are they trying to achieve?
General features of a complex event processing (CEP) system include high throughput, low latency, continuous computation (event-driven), incremental computation, temporal support (windows, ordering), pattern detection, and stream processing.
The speakers discussed Hadoop and use of realtime Microsoft StreamInsight. Hadoop excels at processing all or most historical data, and can host processing for model derivation/calibration. StreamInsight provides a CEP engine, a language interface (LINQ) for CEP queries.
Touted strengths of StreamInsight include developer support, standard LINQ (.NET 4.0+), multiple sources and joins allowed in one statement, multiple aggregates, supported projections and macros, and user-defined operators. StreamInsight is said to be resilient to stream failures, with support of check-pointing and the replaying of streams. Manageability is provided through performance counters, event log alerts etc.
StreamInsight apparently works with 6NF, and it is interesting that this normal form was mentioned because I still remember hearing about it for the first time during graduate school when it was first defined several years ago. Each stream is like a table with a defined window that can be operated upon, permitting sliding windows of time such as 3 minutes, with updates being made every minute, second etc. (The speaker went through this material quickly, so I did not have enough time to get down more notes.)
Comments from original Typepad blog:
Harika: The author gave a valuable information regarding the use of apache hadoop in this present market. Hadoop is ruling the present world.
Thursday, March 26, 2015 at 7:27 AM